
15 KiB
The Rise of Cognitive Observability
- 期号: SRE Weekly Issue #532(2026-08-31)
- 作者: Barnadeep Bhowmik
- 链接: https://pub.towardsai.net/the-rise-of-cognitive-observability-a77e33250037
简介
Traditional observability monitors execution. LLM observability must monitor behavior.
正文
How LLMs are exposing the limits of traditional software observability

Observability for LLMs — evolving traditional deterministic observability for non-deterministic behavior. ( This image was created using an AI image creation program.)
Why Traditional Observability Fails for LLM Systems
Imagine a customer support chatbot confidently explaining a company’s refund policy to thousands of users. The dashboards look perfect: latency is stable, traces complete successfully, and every service appears healthy.
But there is a problem. The chatbot is wrong.
Not catastrophically wrong. Not obviously broken. The responses sound polished, professional, and believable. Most users would trust them immediately. The problem is subtler: a recent prompt update slightly changed how the model interprets edge cases, causing it to invent policy details in borderline scenarios.
From the perspective of traditional observability, nothing failed. And yet, the response is wrong.
Large Language Models (LLMs) are introducing a different kind of failure altogether. Not infrastructure failure, reasoning failure. That distinction matters.
The operational assumptions behind modern observability were built for deterministic systems. LLMs are probabilistic systems that can behave unpredictably while appearing completely healthy from the outside.
The industry is now discovering something uncomfortable: we can monitor servers extremely well, but we still struggle to monitor machine reasoning.
Modern Observability: The Comfort of Determinism
For more than a decade, the industry has become exceptionally good at observing systems. As architectures evolved from monoliths to distributed microservices, observability emerged through metrics, logs, and traces to help engineers reconstruct system behavior externally.
At first glance, LLM systems seem no different. They still run on infrastructure, expose APIs, emit telemetry, and sit behind load balancers. So applying traditional observability feels natural. But traditional systems fail in predictable ways: databases crash, requests timeout, and services degrade under load. LLMs do not.
In traditional systems, cause and effect are linked via deterministic paths.
LLMs do not operate that way. They don’t execute logic. They generate it.
An Example of When the System Works but the Answer Doesn’t
Consider a RAG system inside a financial institution. An analyst requests guidance on a compliance procedure. The retrieval layer works correctly, embeddings match relevant documents, and the model responds within latency thresholds.
But one retrieved document is outdated.
The model confidently generates a coherent, polished, and factually incorrect answer based on stale information.
No errors appear. No alerts trigger. Every infrastructure signal remains healthy.
That is the disconnect.
Traditional observability asks:
- Is the system available?
- Are requests failing?
- Is latency acceptable?
LLM systems introduce harder questions:
- Is the answer correct?
- Is the reasoning grounded?
- Has behavior drifted over time?
Traditional observability monitors execution. LLM observability must monitor behavior.
That is a fundamentally different engineering challenge. And the industry is only beginning to appreciate how significant that shift really is.
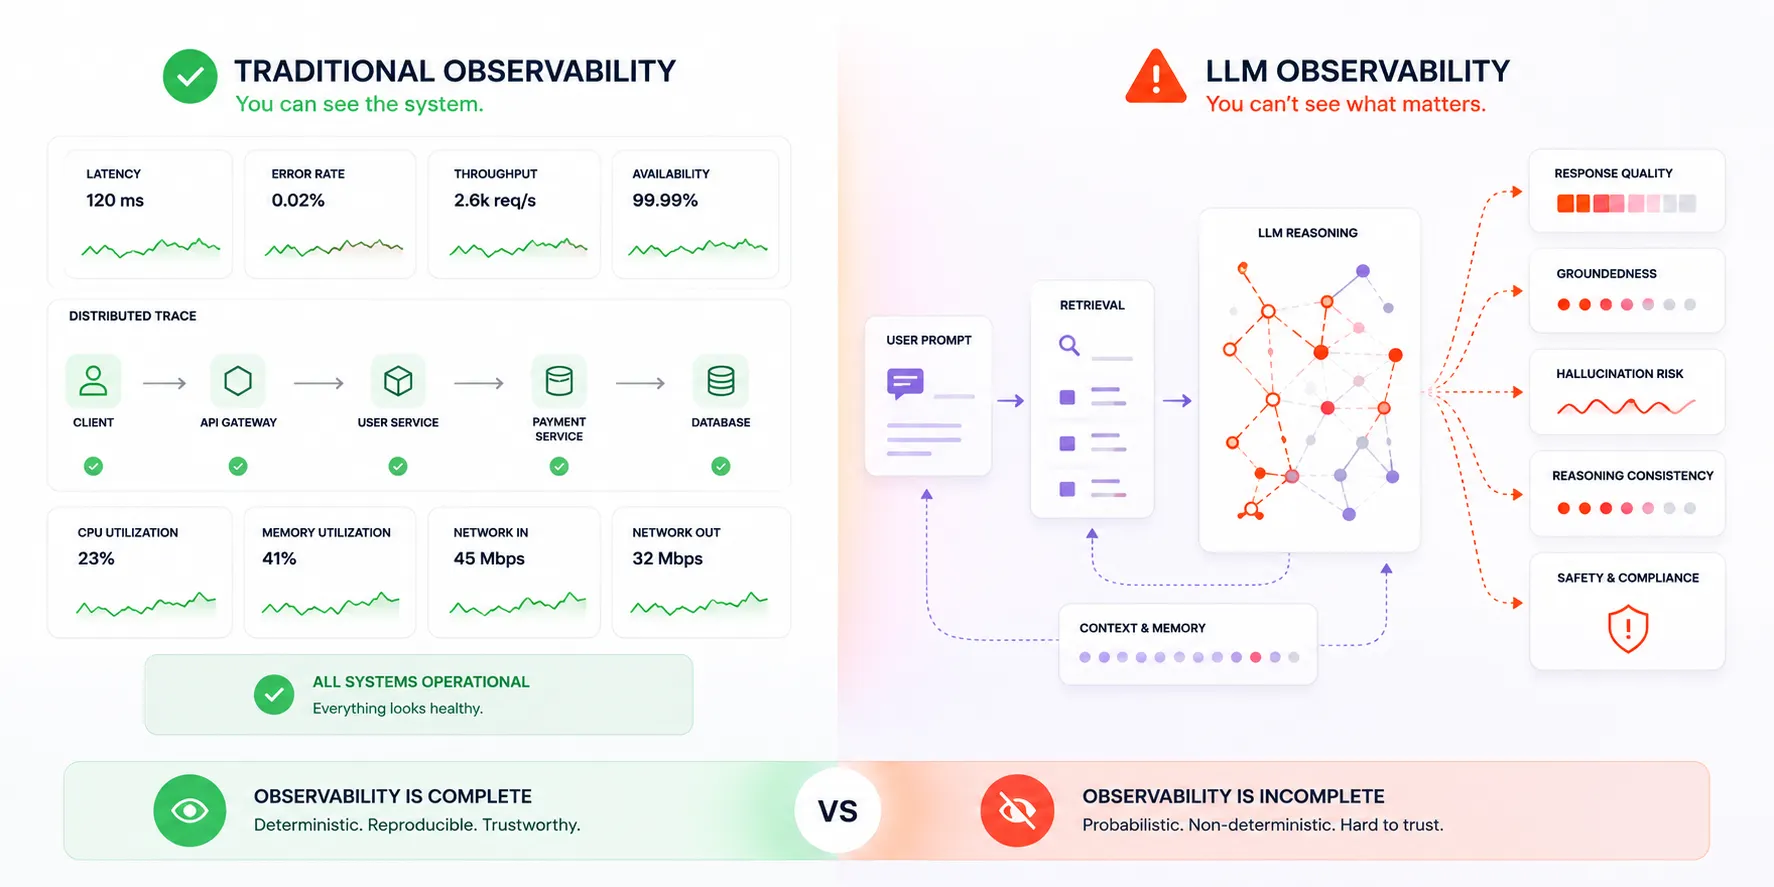
Traditional observability vs LLM observability. ( This image was created using an AI image creation program.)
Non Deterministic Observability
In traditional software, behavior is defined by code. If something changes, engineers can usually trace it back to a deployment or configuration update.
LLMs blur that boundary. In AI systems, the intelligence layer itself becomes part of production infrastructure.
Take prompts, for example. A single sentence added to a system prompt can shift tone, alter reasoning patterns, increase hallucinations, or change how the model responds under uncertainty.
At first, prompts feel like configuration. In practice, they behave far more like production code.
The challenge is that prompt changes rarely produce obvious failures. A tweak intended to make responses “more conversational” may quietly reduce factual reliability.
This creates a new kind of drift.
Not infrastructure drift. Semantic drift.
Observing LLMs: The Illusion of Visibility
Many teams respond to this by instrumenting LLM calls — logging prompts, responses, token usage.
On the surface, this feels like observability. But the real issue isn’t visibility. It’s interpretation.
Imagine an agentic system responsible for automating infrastructure remediation. During an outage, the agent enters a loop. It repeatedly calls the wrong API endpoint, misinterpreting the error signal and retrying indefinitely.
A standard trace will show you everything:
- The sequence of API calls
- The retry logic
- The timing and latency
But it won’t tell you why the agent made that decision.
- Why did it select that tool?
- Why did it misinterpret the error?
- Why did it fail to break the loop
Traditional observability measures operational correctness.
LLM observability increasingly attempts to measure cognitive correctness.
Cognitive correctness is far more difficult to quantify.

Challenges in implmenting observability of LLMs. ( This image was created using an AI image creation program.)
The Fetish of “Correctness Defines Reliability”
Traditional systems treat correctness as binary: a request succeeds or fails, a container is healthy or crashed.
LLMs operate in a far stranger space. A response can be partially correct, subtly misleading, or confidently wrong while sounding entirely believable.
That makes evaluation subjective. A healthcare summary may appear accurate to one reviewer, incomplete to another, and misleading to a third.
And that is the problem.
Many LLM tasks lack a universal ground truth, making simple pass/fail observability impossible.
Instead, teams must build approximation layers:
- Semantic similarity scoring: To compare generated responses against reference answers using embeddings. For example, “Reset your password from the security settings page” and “Password resets are available under account security settings” differ in wording but remain semantically aligned. This helps evaluate relevance without requiring exact matches.
- Groundedness checks: To verify whether a response is actually supported by retrieved context. If a RAG system retrieves documentation stating employees can carry over 10 vacation days, but the model responds with 15, the answer may sound fluent while remaining unsupported by evidence.
- LLM-as-a-judge pipelines: To use one model to evaluate another for factual consistency, reasoning quality, or policy compliance. This approach is increasingly necessary because manually reviewing millions of AI interactions is operationally impossible.
- Heuristic evaluation frameworks: To apply deterministic guardrails such as schema validation, citation enforcement, or rule-based rejection of unsupported financial calculations and malformed outputs.
But each of these introduces its own uncertainty.
You are no longer measuring system state.
You are estimating semantic quality.
Troubleshooting Without Reproducibility
Troubleshooting LLM systems is fundamentally different from debugging traditional software.
Conventional systems are reproducible: given the same inputs, they usually produce the same outputs. LLMs are not strictly deterministic. Responses can vary based on prompt structure, retrieval ordering, hidden model updates, or even subtle context changes.
That creates a strange operational problem. An engineer investigating a production incident may never be able to reproduce the exact output that caused it.
The failure becomes ephemeral.
It existed. It caused impact. But it cannot be recreated precisely.
Observing LLMs is a Data Problem
There is also a second-order challenge many teams underestimate: scale.
LLM observability generates enormous amounts of data. Every interaction may include prompts, completions, embeddings, retrieval metadata, evaluation scores, and intermediate reasoning traces.
At production scale, querying and processing this telemetry quickly becomes a serious infrastructure problem.
But unlike traditional logs, this data carries semantic meaning. It often contains customer conversations, financial records, legal documents, or proprietary knowledge.
LLM observability is not just a telemetry challenge.
It is also a privacy, governance, and compliance challenge.
You are not just observing systems. You are observing intelligence interacting with real-world data.
Emerging Tools, Incomplete Answers
The industry is beginning to respond.
Get Barnadeep Bhowmik’s stories in your inbox
Join Medium for free to get updates from this writer.
New tooling is emerging to make sense of this complexity: tracing frameworks for LLM workflows, evaluation pipelines, integrated observability platforms.
Some tools focus on tracing execution paths across prompts, tools, and agents — allowing engineers to inspect intermediate reasoning steps.
Others focus on evaluation — measuring hallucination rates, grounding quality, and output consistency over time.
There is also a growing effort to integrate LLM observability into existing telemetry ecosystems, rather than treating it as a separate stack.
Here are some that you can use today:
LangSmith
LangSmith is one of the most widely adopted platforms in the space, particularly among teams building applications with LangChain.
Its core strength is tracing.
At first glance, tracing LLM systems may sound similar to tracing microservices. But the value becomes more obvious in agentic workflows where a single request may involve:
- multiple prompts,
- retrieval steps,
- tool invocations,
- memory updates,
- and reasoning chains.
Without visibility into intermediate behavior, debugging these systems becomes extremely difficult.
A simple LangSmith trace looks like this:
from langsmith import traceable

@traceable
def generate_answer(question):
    return llm.invoke(question)
Once instrumented, developers can inspect:
- prompt flows,
- execution timing,
- intermediate outputs,
- and tool interactions.
LangSmith becomes particularly useful when engineers need to answer questions like: Why did the agent make this decision?
Langfuse
Langfuse approaches observability from a more operational perspective.
One reason it has gained attention is because many enterprises remain uncomfortable sending sensitive AI telemetry into third-party SaaS platforms.
Langfuse offers open-source and self-hosted capabilities, making it attractive for organizations with strict compliance requirements.
A simple integration looks like this:
from langfuse import Langfuse

langfuse = Langfuse()
trace = langfuse.trace(
    name="customer-support-chatbot"
)
generation = trace.generation(
    name="llm-response",
    model="gpt-4"
)
At first, this appears similar to traditional application telemetry.
But the real value comes from observing behavioral trends over time:
- Which prompts produce poor outcomes?
- Which workflows generate excessive token costs?
- Which retrieval pipelines correlate with hallucinations?
Langfuse attempts to operationalize these questions through tracing and evaluation layers.
OpenLLMetry
OpenLLMetry takes a particularly interesting architectural approach.
Rather than building an entirely separate observability ecosystem for AI, it extends OpenTelemetry concepts into LLM systems.
That may sound subtle, but it is strategically important.
Most enterprises already have mature observability pipelines:
- dashboards,
- collectors,
- tracing backends,
- alerting systems,
- and telemetry standards.
Completely replacing those systems for AI workloads would be operationally unrealistic.
OpenLLMetry instead tries to bridge the gap.
Example instrumentation:
from traceloop.sdk import Traceloop

Traceloop.init()
response = client.chat.completions.create(
    model="gpt-4",
    messages=[
        {"role": "user", "content": "Hello"}
    ]
)
The framework can automatically capture:
- prompts,
- responses,
- token usage,
- latency,
- and execution metadata.
That interoperability matters because many organizations do not want isolated AI observability silos. They want AI telemetry integrated into existing operational ecosystems.
And over time, that may become one of the most important architectural directions in the space.
Why Adoption Is Slower Than Expected
At first glance, AI observability feels inevitable. If organizations are deploying LLMs into production, they need visibility into hallucinations, reasoning failures, and agent behavior.
But adoption has been slower than expected.
Traditional observability matured over decades around stable operational patterns. LLM observability remains immature, with rapidly evolving frameworks, evaluation methods, and unclear definitions of reliable AI behavior.
The deeper problem is that AI failures are difficult to measure. Infrastructure failures are objective. Reasoning failures are not.
At enterprise scale, privacy, compliance, and operational complexity make the challenge even harder. Like most reliability disciplines, AI observability is evolving reactively through production failures.
Final Thought
We spent years learning how to observe machines. Now we are learning how to observe machine thinking.
And the tools, both conceptual and technical, are still catching up.
The dashboards may still be green. But the real system, the one that matters, is no longer just infrastructure.
It is behavior. And that is much harder to monitor.
“The most dangerous AI failures are not the ones that crash. They are the ones that sound convincing.”