
139 lines
8.7 KiB
Markdown
139 lines
8.7 KiB
Markdown
# Composite SLO
|
||
|
||
- **期号**: SRE Weekly Issue #420(2024-04-15)
|
||
- **作者**: Alex Ewerlöf
|
||
- **链接**: https://blog.alexewerlof.com/p/composite-slo
|
||
|
||
## 简介
|
||
|
||
This one contains formulas for calculating compound SLOs when downstream dependencies are parallel or serial.
|
||
|
||
## 正文
|
||
|
||
Complex systems are made of many components. We may have a [Service Level Objective (SLO)](https://blog.alexewerlof.com/p/slo) for each component but how do we calculate the SLO for the entire system?
|
||
|
||
For example, if you have 4 replicas of a microservice, how exactly does it improve the reliability of the whole?
|
||
|
||
Or if a system can only function if all its dependencies are functioning, how do we calculate the reliability of that system?
|
||
|
||
System engineering has two simple rules for calculating composite SLO:
|
||
|
||
- Multiply **SLOs** for**serial** dependencies
|
||
- Multiply **error budgets** for**parallel** dependencies
|
||
|
||
Both use a [basic concept](https://onlinestatbook.com/2/probability/basic.html) in probability theory:
|
||
|
||
The probability of two *independent* events happening at the same time is the result of multiplying the probability of each one happening individually.
|
||
|
||
Let’s unpack that with plenty of examples.
|
||
|
||
Notes:
|
||
|
||
- *Composite SLO* is about how to calculate the SLO of different sub-systems in a complex system. It’s not to be confused with*[multi-tiered SLO](https://blog.alexewerlof.com/p/multi-tiered-slos)* which is about having multiple SLOs for the same system.
|
||
- *The first two examples in this article are very simplified to demonstrate the math. We then add a more complex example afterwards.*
|
||
|
||
# Serial Dependencies
|
||
|
||
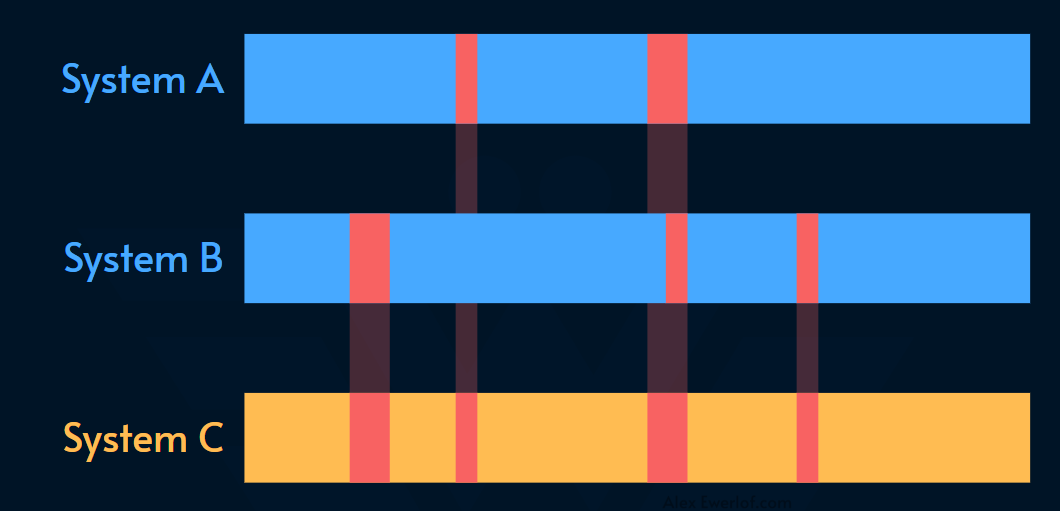
In the diagram below, we have 3 systems:
|
||
|
||

|
||
|
||
System C: an API that has two hard dependencies
|
||
|
||
1. System A: an database with the availability of `99.8%`
|
||
2. System B: an upstream API with the availability of `95.3%`
|
||
|
||
For the sake of simplicity, we assume that these two dependencies run on a different infrastructure (e.g. bought from a 3rd party) and System C does not have any resilience architecture in place meaning if any of A or B go down, C also goes down.
|
||
|
||
Here, the downtime is marked in red over a period of time (e.g. 1 month):
|
||
|
||
|
||
|
||
As we can see, the probability of System C being **available** equals to the probability of System A **and** B being **available**.
|
||
|
||
SLO is expressed in percentage, but we use numbers in the 0 to 1 range when using probability math:
|
||
|
||
1. Probability of system B being available: `0.998`
|
||
2. Probability of System C being available: `0.953`
|
||
|
||
Expressed in percentage, the SLO of System A is 95.1094%
|
||
|
||
As you can see, the availability of System A is worse than its least reliable dependency, which is expected in the case of serial dependency.
|
||
|
||
# Parallel Dependencies
|
||
|
||
In the diagram below, we have 3 systems:
|
||
|
||

|
||
|
||
System C: an API gateway that has two parallel dependencies:
|
||
|
||
1. System A: an upstream in the local region with the availability of `99.8%`
|
||
2. System B: the same upstream in another region with the availability of `95.3%`
|
||
|
||
We picked the same availability numbers as before just to see how serial and parallel dependencies impact the overall system reliability.
|
||
|
||
Looking at the uptime of those systems we can see that system C is available when either System A or B are available:
|
||
|
||

|
||
|
||
As we can see, the probability of System A being **unavailable** equals to the probability of System B **and** C being **unavailable**.
|
||
|
||
Converting SLO percentage to the 0 to 1 range to make them suitable for probability math we have:
|
||
|
||
1. Probability of system B being unavailable: `1 - 0.998 = 0.002`
|
||
2. Probability of System C being unavailable: `1 - 0.953 = 0.047`
|
||
|
||
Probability of System A being unavailable = `0.002 x 0.047 = 0.000094`
|
||
|
||
Converting it to the percentage, we get 0.0094% but that is unavailability (i.e. the *[error budget](https://blog.alexewerlof.com/p/error-budget)*). The SLO will be the complement of that:
|
||
|
||
System A availability = `100% - 0.0094% = 99.9906%`
|
||
|
||
As you can see, the availability of System A is better than its most reliable dependency, which is expected in the case of parallel dependency.
|
||
|
||
# More Complex and Realistic Example
|
||
|
||
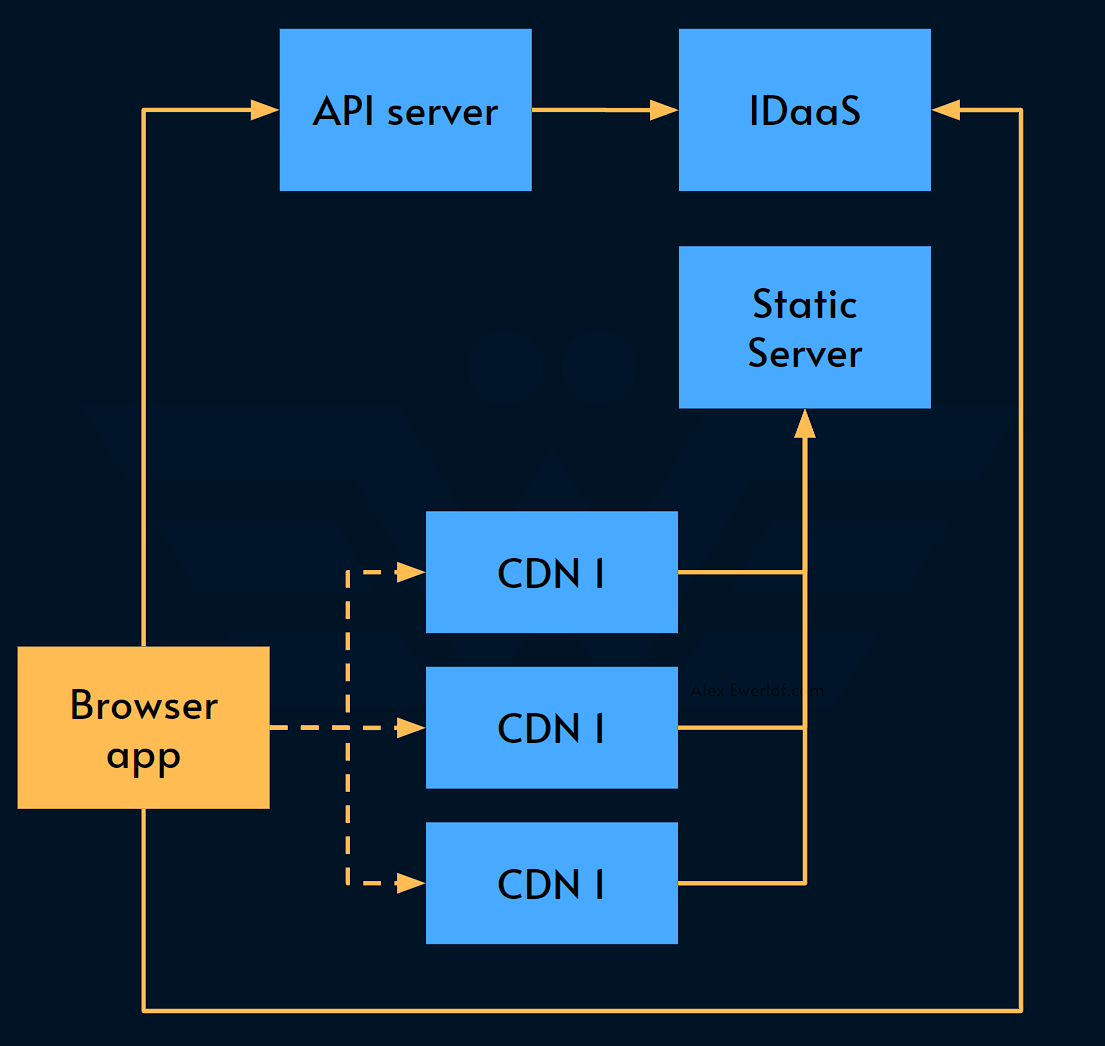
This is a typical website example:
|
||
|
||
|
||
|
||
- **Static server** serves the website assets like HTML, JavaScript, CSS, images, etc. This simple service is run behind CDN which is available from multiple locations
|
||
- **CDN:** Content Delivery Network distributes static files across the globe. CDN usually has a cache that acts as a[fallback](https://blog.alexewerlof.com/p/fallback) mechanism for when the upstream server is down. This CDN also has a[failover](https://blog.alexewerlof.com/p/failover) mechanism to automatically pick the next node when one of the nodes is down.
|
||
- **API server:** supports the functionality of the web app. For example, it can be a BFF (dedicated backend for frontend), or a GraphQL server abstracting away multiple other APIs toward the browser application.
|
||
- **IDaaS:** The website and API server both depend on a 3rd party identity as-a-service provider.
|
||
|
||
Based on the research, you get the following availability numbers:
|
||
|
||
- The CDN provider commits to 99.9% availability for each of their edge nodes
|
||
- The IDaaS provider commits to 99% availability in their SLA
|
||
- The static file server is available 98% of the time based on historical data
|
||
- The API server is available 95% of the time. That is because the API server has hard dependencies to other upstream services which are not shown in the diagram.
|
||
|
||
So how do we go about calculating the availability of the browser application?
|
||
|
||
It has 3 dependencies:
|
||
|
||
- **CDN** is available if any of its 3 nodes are available.
|
||
- Each CDN node has a serial dependency on the static server. Therefore, the usefulness of the CDN node is `0.999 x 0.98 = 0.97902` . This means the error budget for each CDN node is`1 - 0.97902 = 0.02098`
|
||
- There are 3 CDN nodes in parallel, so the collective error budget is calculated from multiplying their error budgets: `0.02098 x 0.02098 x 0.02098 = 0.00000923456`
|
||
- Therefore, the availability of the CDN is `1 - 0.00000923456 = 0.99999076544`
|
||
- The whole CDN (including the 3 nodes) can be seen as one serial dependency for the browser app.
|
||
- **API server** is available 95% but since it also requires the IDaaS provider to serve the browser, its availability is`0.95 x 0.99 = 0.9405`
|
||
- IDaaS is available `99%` towards the browser too. Converted to 0-1 range, we get`0.99`
|
||
|
||
Putting them all together, the browser app’s availability is the multiplication of all its serial dependencies for it to be served, function, and identify the user:
|
||
|
||
`0.99999076544 x 0.9405 x 0.99 = 0.93108640174`
|
||
|
||
Converted to percentage, we get `93.108640174%` or `93.1%` for short.
|
||
|
||
Is it good? Is it bad? It really depends on what makes sense to your service consumers as we discussed in “lagom” SLO:
|
||
|
||
|
||

|
||
|
||
# Pro-Tips
|
||
|
||
[My monetization strategy](https://blog.alexewerlof.com/p/faq#%C2%A7payment) is to give away most of content for free. However, these posts take anywhere from a few hours to days to draft, edit, illustrate, and publish. I pull these hours from my private time and weekends. For those who spare a few bucks, the pro-tips are a token of appreciation. The bar for pro-tips is to give tools and mindset that you can use at your work to earn more. Right now, you can get 20% off via [this link](https://blog.alexewerlof.com/protipsdiscount). If you don’t want to spend money, sharing it with a wider audience also helps. Thanks in advance.
|