
413 lines
17 KiB
Markdown
413 lines
17 KiB
Markdown
# Automating GCP quota monitoring across multiple projects
|
||
|
||
- **期号**: SRE Weekly Issue #524(2026-07-05)
|
||
- **作者**: Aksel Allas — Coop Norge SA
|
||
- **链接**: https://tech.coop.no/blog/platform-engineering/2026/06/25/automating-gcp-quota-monitoring-across-multiple-projects/
|
||
|
||
## 简介
|
||
|
||
> Every GCP resource and API have quotas. In a big organization, you can start having production incidents due to hitting quotas you didn’t know about in projects you have never touched before.
|
||
|
||
## 正文
|
||
|
||
# Automating GCP quota monitoring across multiple projects[¶](https://tech.coop.no#automating-gcp-quota-monitoring-across-multiple-projects)
|
||
|
||
Every GCP resource and API have quotas. In a big organization, you can start having production incidents due to hitting quotas you didn't know about in projects you have never touched before.
|
||
|
||
## The incidents[¶](https://tech.coop.no#the-incidents)
|
||
|
||
In May 2026, a VPC dynamic route quota was silently exceeded. GCP dropped BGP-learned (Border Gateway Protocol) routes without any alert. Traffic to on-prem destinations fell back to the default internet gateway and was black-holed (dropped without notification).
|
||
|
||
A couple production services were down before the issue was
|
||
traced to `routeStatus: DROPPED` in the Cloud Router output.
|
||
|
||
The fix was a quota increase and a BGP re-sync, but finding the root cause took a long time because nothing indicated that a quota had been hit.
|
||
|
||
A separate incident involved GKE Persistent Disk storage: usage grew from 900 GB to the 1000 GB limit during a GKE version update without anyone noticing until provisioning workloads started failing.
|
||
|
||
Both incidents had the same root cause: **zero visibility into
|
||
GCP quotas** across GCP projects.
|
||
|
||
## Why native solutions fall short[¶](https://tech.coop.no#why-native-solutions-fall-short)
|
||
|
||
GCP does have quota monitoring built into
|
||
GCP Cloud Monitoring.
|
||
[Here's the best doc on monitoring ⧉](https://cloud.google.com/monitoring/alerts/using-quota-metrics).
|
||
You can create alert policies across projects that fire when
|
||
a quota approaches its limit. So why wasn't it being used?
|
||
|
||
The problem is that GCP has **two completely separate quota
|
||
metric systems**, and neither supports a simple "alert on
|
||
everything" approach.
|
||
|
||
### Consumer quotas[¶](https://tech.coop.no#consumer-quotas)
|
||
|
||
The first system uses `serviceruntime.googleapis.com/quota/*`
|
||
metrics with a generic `consumer_quota` resource type. These
|
||
cover API-level quotas: request rates, allocation limits,
|
||
storage quotas, and similar. A single `quota_metric` label
|
||
identifies which specific quota the time series belongs to.
|
||
|
||
The good news: you can write a [PromQL ⧉](https://prometheus.io/docs/prometheus/latest/querying/basics/)
|
||
(Prometheus Query Language) query that matches
|
||
**all** consumer quotas without specifying individual services
|
||
or quota names. PromQL is a language for selecting and
|
||
aggregating time series metrics. GCP Cloud Monitoring supports
|
||
it as an alternative to its native query language, and it's
|
||
what powers the alert conditions described below.
|
||
|
||
### Resource-specific quotas[¶](https://tech.coop.no#resource-specific-quotas)
|
||
|
||
The second system uses service-specific metrics like
|
||
`compute.googleapis.com/quota/dynamic_routes_per_region_per_peering_group/usage`.
|
||
Each service defines its own monitored resource type and label
|
||
set. These cover infrastructure-level quotas: VPC routes,
|
||
instances per network, GKE nodes per cluster.
|
||
|
||
These aren't covered by consumer quota queries. Each metric
|
||
has its own path and its own set of labels for the `on()`
|
||
clause in PromQL. There are currently over 370 such metrics
|
||
across 28 services.
|
||
|
||
The VPC routing incident? That was a resource-specific quota. The native consumer quota alerts would never have caught it.
|
||
|
||
## The solution[¶](https://tech.coop.no#the-solution)
|
||
|
||
The requirements:
|
||
|
||
1. Covers both quota systems
|
||
2. Automatically picks up new quotas and services
|
||
3. Works across all 300 monitored projects from a single place
|
||
4. Doesn't require manual configuration per quota
|
||
|
||
### Architecture[¶](https://tech.coop.no#architecture)
|
||
|
||
```
|
||
graph LR
|
||
subgraph "Scoping Project"
|
||
MS[Metrics Scope] --> AP[Alert Policies]
|
||
AP --> NC[Slack Channel]
|
||
end
|
||
subgraph "Monitored Projects"
|
||
P1[project-1] --> MS
|
||
P2[project-2] --> MS
|
||
P3[project-N] --> MS
|
||
end
|
||
subgraph "Auto-Discovery via github repo for managing Scoping Project"
|
||
TF[Terraform] -->|data external| SH[get_quota_metrics.sh]
|
||
SH -->|Cloud Monitoring API| PY[build_quota_promql.py]
|
||
PY -->|per-service PromQL| TF
|
||
end
|
||
TF --> AP
|
||
```
|
||
All alerts run in a single **scoping project**. Every monitored
|
||
project gets added to its
|
||
[metrics scope ⧉](https://cloud.google.com/monitoring/settings/multiple-projects),
|
||
so one set of alert policies covers every project. PromQL
|
||
queries group by `project_id`, `quota_metric`, `location`, and
|
||
`service`, so each unique combination fires as a separate
|
||
incident. You know exactly which quota in which project and
|
||
region is at risk.
|
||
|
||
### Consumer quota alerts[¶](https://tech.coop.no#consumer-quota-alerts)
|
||
|
||
For consumer quotas, there are three alert policies. No service filter, no quota name filter. They match all consumer quotas automatically.
|
||
|
||
**Allocation usage > 80%:** resource limits like disk, CPU,
|
||
IP addresses:
|
||
|
||
```
|
||
(
|
||
max by (project_id, quota_metric, location, service) (
|
||
last_over_time(
|
||
serviceruntime_googleapis_com:quota_allocation_usage{
|
||
monitored_resource="consumer_quota"
|
||
}[6h]
|
||
)
|
||
)
|
||
/
|
||
min by (project_id, quota_metric, location, service) (
|
||
last_over_time(
|
||
serviceruntime_googleapis_com:quota_limit{
|
||
monitored_resource="consumer_quota"
|
||
}[6h]
|
||
)
|
||
)
|
||
) > 0.8
|
||
```
|
||
**Rate usage > 80%:** API request rates, with read-only APIs
|
||
excluded to reduce noise. Hitting a read rate limit causes
|
||
retries, not outages:
|
||
|
||
```
|
||
(
|
||
sum by (project_id, quota_metric, location, service) (
|
||
increase(
|
||
serviceruntime_googleapis_com:quota_rate_net_usage{
|
||
monitored_resource="consumer_quota",
|
||
quota_metric!~".*/get_.*|.*/list_.*|.*read_requests.*|.*/read$|.*/fetch_.*|.*search_requests.*"
|
||
}[1m]
|
||
)
|
||
)
|
||
/
|
||
max by (project_id, quota_metric, location, service) (
|
||
last_over_time(
|
||
serviceruntime_googleapis_com:quota_limit{
|
||
monitored_resource="consumer_quota",
|
||
quota_metric!~".*/get_.*|.*/list_.*|.*read_requests.*|.*/read$|.*/fetch_.*|.*search_requests.*"
|
||
}[6h]
|
||
)
|
||
)
|
||
) > 0.8
|
||
```
|
||
**Quota exceeded:** safety net for anything that slips past the
|
||
80% warning, with the same read-only exclusion:
|
||
|
||
```
|
||
max by (project_id, quota_metric, location, service) (
|
||
last_over_time(
|
||
serviceruntime_googleapis_com:quota_exceeded{
|
||
monitored_resource="consumer_quota",
|
||
quota_metric!~".*/get_.*|.*/list_.*|.*read_requests.*|.*/read$|.*/fetch_.*|.*search_requests.*"
|
||
}[6h]
|
||
)
|
||
) > 0
|
||
```
|
||
When someone enables a new GCP API or Google adds a new quota, these queries pick it up with zero configuration changes.
|
||
|
||
### Resource-specific quota alerts[¶](https://tech.coop.no#resource-specific-quota-alerts)
|
||
|
||
Resource-specific quotas can't be covered by a single query.
|
||
Each metric has different labels. A VPC network quota has
|
||
`network_id`, a GKE quota has `cluster_name`, an AI Platform
|
||
quota has `base_model`. The PromQL `on()` clause must match per
|
||
metric.
|
||
|
||
Instead of maintaining a static list, a discovery script runs
|
||
as a Terraform
|
||
[`data "external"` ⧉](https://registry.terraform.io/providers/hashicorp/external/latest/docs/data-sources/external)
|
||
source. Here's how it works in detail.
|
||
|
||
#### Step 1: fetch metric descriptors[¶](https://tech.coop.no#step-1-fetch-metric-descriptors)
|
||
|
||
A bash wrapper calls the GCP Cloud Monitoring API to get every metric descriptor in the scoping project. This includes metrics from all projects in the metrics scope:
|
||
|
||
```
|
||
curl -s -H "Authorization: Bearer ${TOKEN}" \
|
||
"${BASE_URL}/metricDescriptors" > "${METRICS_FILE}"
|
||
curl -s -H "Authorization: Bearer ${TOKEN}" \
|
||
"${BASE_URL}/monitoredResourceDescriptors" \
|
||
> "${RESOURCES_FILE}"
|
||
```
|
||
The metric descriptors tell you what quota metrics exist (for
|
||
example,
|
||
`compute.googleapis.com/quota/dynamic_routes_per_region_per_peering_group/usage`)
|
||
and what **metric labels** each one has (for example,
|
||
`limit_name`).
|
||
|
||
The resource descriptors tell you what **resource labels** each
|
||
monitored resource type has. For example,
|
||
`compute.googleapis.com/VpcNetwork` has `resource_container`,
|
||
`location`, and `network_id`.
|
||
|
||
#### Step 2: filter to resource-specific quota metrics[¶](https://tech.coop.no#step-2-filter-to-resource-specific-quota-metrics)
|
||
|
||
A Python script processes the JSON. It finds all metrics
|
||
matching the pattern
|
||
`<service>.googleapis.com/quota/<name>/usage` and `*/limit`,
|
||
excluding `serviceruntime` (those are consumer quotas handled
|
||
separately) and `*_internal` metrics (they have descriptors but
|
||
get rejected by the alerting API):
|
||
|
||
#### Step 3: resolve the correct `on()` labels[¶](https://tech.coop.no#step-3-resolve-the-correct-on-labels)
|
||
|
||
This is the tricky part. For the PromQL division
|
||
`usage / limit` to work, the `on()` clause must list every
|
||
label shared between the two sides. These labels come from two
|
||
sources: the resource type and the metric itself.
|
||
|
||
One gotcha: the resource descriptor calls the project label
|
||
`resource_container`, but in actual PromQL queries it appears
|
||
as `project_id`. This was discovered by querying the raw time
|
||
series API and comparing:
|
||
|
||
For quotas where usage has extra labels that limit doesn't
|
||
(mainly AI Platform metrics with a `method` label),
|
||
`group_left()` allows the many-to-one join.
|
||
|
||
#### Step 4: convert metric names and generate PromQL[¶](https://tech.coop.no#step-4-convert-metric-names-and-generate-promql)
|
||
|
||
[GCP Cloud Monitoring PromQL ⧉](https://docs.cloud.google.com/monitoring/promql#transforming-names) uses a different
|
||
naming convention than the API. The first `/` becomes `:`, and
|
||
all other special characters become `_`:
|
||
|
||
Each quota becomes one PromQL clause:
|
||
|
||
```
|
||
clause = (
|
||
f"last_over_time({usage_name}[{lookback}])"
|
||
f" / on({on_labels}) group_left() "
|
||
f"last_over_time({limit_name}[{lookback}])"
|
||
f" > {threshold}"
|
||
)
|
||
```
|
||
#### Step 5: group by service[¶](https://tech.coop.no#step-5-group-by-service)
|
||
|
||
Clauses are grouped by service name extracted from the metric
|
||
path and joined with `or`. The script outputs a flat JSON
|
||
object with keys as service names, and values as complete
|
||
PromQL queries:
|
||
|
||
```
|
||
{
|
||
"compute": "last_over_time(...) / on(...) ... > 0.8\nor\nlast_over_time(...) ...",
|
||
"container": "...",
|
||
"storage": "..."
|
||
}
|
||
```
|
||
Terraform's `for_each` iterates over this map, creating one
|
||
alert policy per service. Currently that's 28 services covering
|
||
370+ quota metrics. When Google adds a new service with
|
||
resource-specific quotas, the next `terraform apply` creates a
|
||
new alert policy automatically.
|
||
|
||
A generated query for compute quotas looks like this (one
|
||
clause per quota, joined with `or`):
|
||
|
||
```
|
||
last_over_time(compute_googleapis_com:quota_dynamic_routes_per_region_per_peering_group_usage[6h])
|
||
/ on(limit_name, location, network_id, project_id) group_left()
|
||
last_over_time(compute_googleapis_com:quota_dynamic_routes_per_region_per_peering_group_limit[6h])
|
||
> 0.8
|
||
or
|
||
last_over_time(compute_googleapis_com:quota_instances_per_vpc_network_usage[6h])
|
||
/ on(limit_name, location, network_id, project_id) group_left()
|
||
last_over_time(compute_googleapis_com:quota_instances_per_vpc_network_limit[6h])
|
||
> 0.8
|
||
```
|
||
When a new service adds resource-specific quota metrics, the
|
||
next `terraform apply` creates a new alert policy for that
|
||
service automatically.
|
||
|
||
### The Terraform[¶](https://tech.coop.no#the-terraform)
|
||
|
||
The Terraform configuration ties it all together. The
|
||
[`for_each` ⧉](https://developer.hashicorp.com/terraform/language/meta-arguments/for_each)
|
||
over the discovery script output creates one alert policy per
|
||
service:
|
||
|
||
```
|
||
data "external" "quota_metrics" {
|
||
program = [
|
||
"bash",
|
||
"${path.module}/scripts/get_quota_metrics.sh",
|
||
local.quota_monitoring_project_id,
|
||
tostring(local.quota_alert_threshold),
|
||
local.quota_alert_lookback,
|
||
]
|
||
query = {
|
||
exclusions = jsonencode(local.quota_alert_exclusions)
|
||
}
|
||
}
|
||
resource "google_monitoring_alert_policy" "quota_resource_specific" {
|
||
for_each = data.external.quota_metrics.result
|
||
project = local.quota_monitoring_project_id
|
||
display_name = "Quota > 80% - ${each.key} resource quotas"
|
||
conditions {
|
||
display_name = "${each.key} resource quota > 80%"
|
||
condition_prometheus_query_language {
|
||
query = each.value
|
||
duration = "0s"
|
||
evaluation_interval = "30s"
|
||
}
|
||
}
|
||
notification_channels = local.quota_alert_notification_channels
|
||
}
|
||
```
|
||
## Technical challenges[¶](https://tech.coop.no#technical-challenges)
|
||
|
||
### Sparse sampling and alert flapping[¶](https://tech.coop.no#sparse-sampling-and-alert-flapping)
|
||
|
||
Quota metrics are sampled infrequently. Data points arrive every 5 to 15 minutes with gaps. Alerts would fire when a data point showed usage exceeding 80%, then immediately resolve when the next evaluation found no data, then fire again when the next data point arrived.
|
||
|
||
PromQL alert conditions don't support
|
||
`evaluation_missing_data = "EVALUATION_MISSING_DATA_ACTIVE"`
|
||
(that's only available for `condition_threshold`). The fix was
|
||
wrapping every metric selector in `last_over_time(...[6h])`,
|
||
which returns the most recent data point within the look-back
|
||
window. No more flapping.
|
||
|
||
### The `resource_container` gotcha[¶](https://tech.coop.no#the-resource_container-gotcha)
|
||
|
||
The GCP Cloud Monitoring API's resource descriptors list a
|
||
label called `resource_container`, but in actual PromQL
|
||
queries, that label appears as `project_id`. This was
|
||
discovered by querying the raw time series API and comparing
|
||
label names. The script maps `resource_container` to
|
||
`project_id` automatically.
|
||
|
||
### Label mismatches between usage and limit[¶](https://tech.coop.no#label-mismatches-between-usage-and-limit)
|
||
|
||
For some quotas (mainly AI Platform), the `/usage` metric has
|
||
an extra `method` label that the `/limit` metric doesn't have.
|
||
A naive division fails because PromQL can't match series with
|
||
different label sets. Using `group_left()` handles the
|
||
many-to-one join.
|
||
|
||
### Read-only API quota noise[¶](https://tech.coop.no#read-only-api-quota-noise)
|
||
|
||
Rate quota alerts were extremely noisy. Quotas like
|
||
`read_requests`, `list_requests`, and `search_requests` would
|
||
fire constantly. Hitting a read rate limit causes retries, not
|
||
outages. It's low-risk noise that drowns out real issues.
|
||
|
||
A regular expression filter on the `quota_metric` label
|
||
excludes read-only patterns:
|
||
|
||
```
|
||
quota_metric!~".*/get_.*|.*/list_.*|.*read_requests.*|.*/read$|.*/fetch_.*|.*search_requests.*"
|
||
```
|
||
## The workflow: alert to resolution[¶](https://tech.coop.no#the-workflow-alert-to-resolution)
|
||
|
||
When a quota alert fires, here's the investigation path:
|
||
|
||
**1. Alert arrives in Slack** with the project ID, quota name,
|
||
service, and current ratio.
|
||
|
||
**2. Check the Quotas page** in the GCP Console for the
|
||
affected project. The
|
||
[Quotas & System Limits ⧉](https://console.cloud.google.com/iam-admin/quotas)
|
||
page shows current usage alongside limits.
|
||
|
||
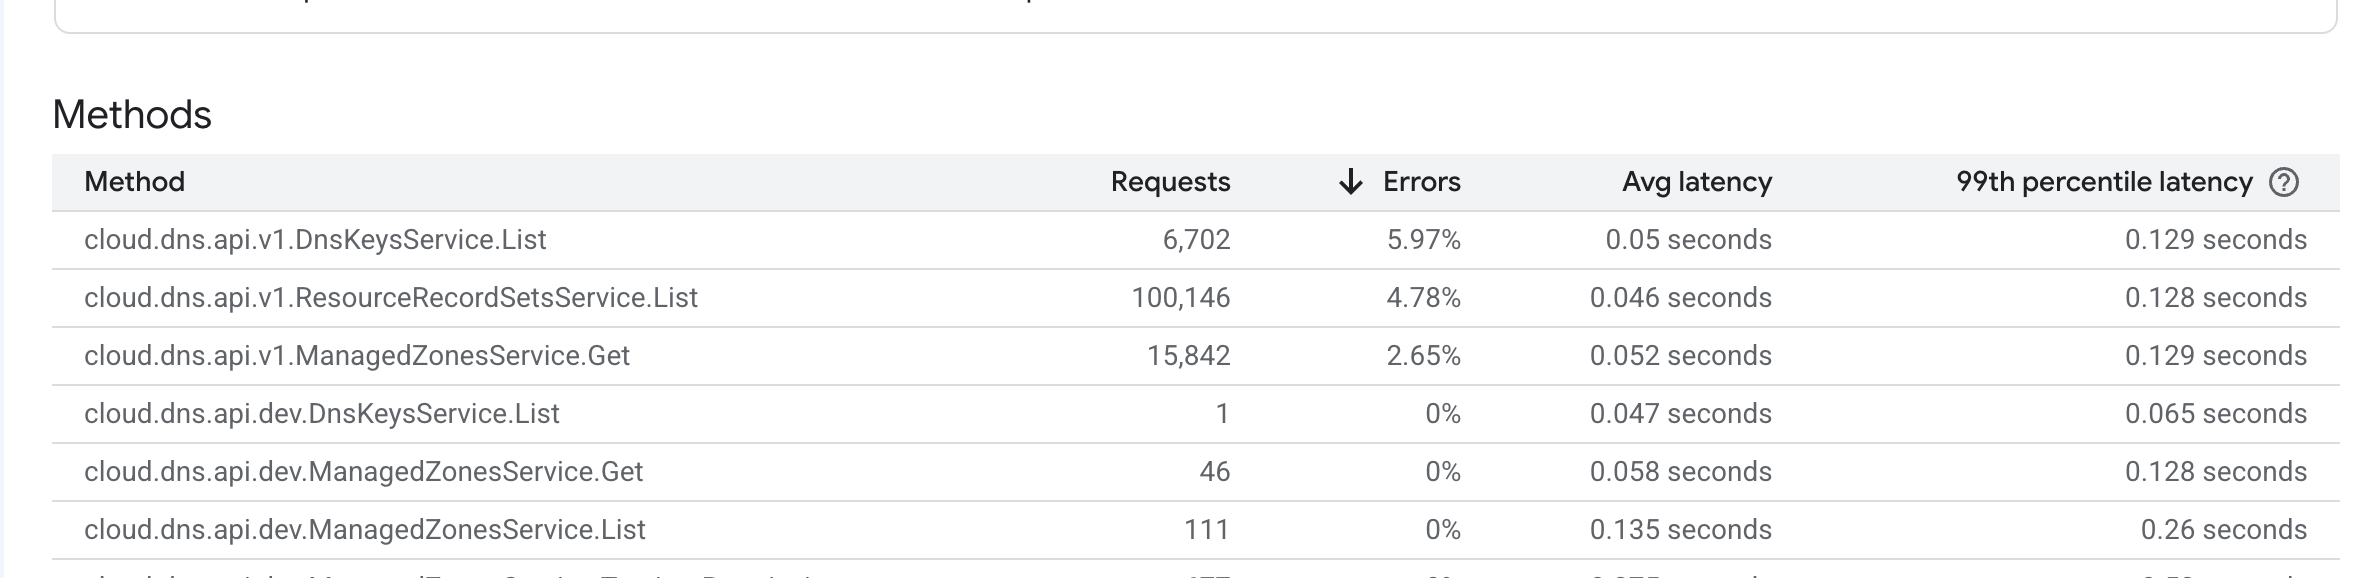
**3. Check API usage and error rates** to understand what's
|
||
driving the consumption. The API dashboard shows request counts,
|
||
error rates, and latency per method:
|
||
|
||
|
||
|
||
|
||
**4. Increase the quota** if the usage is legitimate. Some
|
||
quotas can be increased through self-service.
|
||
|
||
Some quotas are marked `is_fixed` and require a support ticket
|
||
to increase. The VPC dynamic routes quota that caused the first
|
||
incident was one of these.
|
||
|
||
## APIs to enable[¶](https://tech.coop.no#apis-to-enable)
|
||
|
||
Three APIs need to be enabled on each monitored project for quota metrics to flow correctly:
|
||
|
||
| API | Why |
|
||
|---|---|
|
||
| `cloudquotas.googleapis.com` | Accurate quota data. Not on by default. |
|
||
| `storage-component.googleapis.com` | Google Cloud Storage quota visibility |
|
||
| `storage.googleapis.com` | Google Cloud Storage quota visibility |
|
||
|
||
These get enabled through Terraform on all monitored projects once in the beginning, and were added to the new project Terraform module so future projects get them automatically.
|
||
|
||
## Links and resources[¶](https://tech.coop.no#links-and-resources)
|
||
|
||
- [Cloud Monitoring: Using quota metrics ⧉](https://cloud.google.com/monitoring/alerts/using-quota-metrics) Google's documentation on quota alerting
|
||
- [Metrics scopes overview ⧉](https://cloud.google.com/monitoring/settings/multiple-projects) Multi-project monitoring (375 project default limit)
|
||
- [PromQL metric name transformation ⧉](https://docs.cloud.google.com/monitoring/promql#transforming-names) How GCP metric names map to PromQL names
|