
187 lines
12 KiB
Markdown
187 lines
12 KiB
Markdown
# How We Improved Our Server Performance
|
||
|
||
- **期号**: SRE Weekly Issue #60(2017-02-20)
|
||
- **作者**: —
|
||
- **链接**: https://dzone.com/articles/how-we-improved-our-server-performance-to-100m-mes
|
||
|
||
## 简介
|
||
|
||
Open source IoT platform ThingsBoard’s authors share a detailed account of how they diagnosed and fixed reliability and throughput issues in their software so that it could handle 30k incoming events per second.
|
||
|
||
## 正文
|
||
|
||
-
|
||
 [Post an Article](https://dzone.com/content/article/post.html)
|
||
-
|
||
[Manage My Drafts](https://dzone.com)
|
||
|
||
# How We Improved Our Server Performance
|
||
|
||
By using an asynchronous Cassandra driver API, doing connection pooling, and performing horizontal and vertical scaling, you can improve your IoT platform's performance.
|
||
|
||
Join the DZone community and get the full member experience.
|
||
|
||
[Join For Free](https://dzone.com/static/registration.html)
|
||
|
||
One of the key features of Thingsboard's open-source IoT platform is data collection. This is a crucial feature that must work reliably under high loads. In this article, we are going to describe steps and improvements that can help ensure that a single instance of the Thingsboard server can constantly handle 20,000+ devices and 30,000+ MQTT publish messages per second — which gives us around two million published messages per minute.
|
||
|
||
## Architecture
|
||
|
||
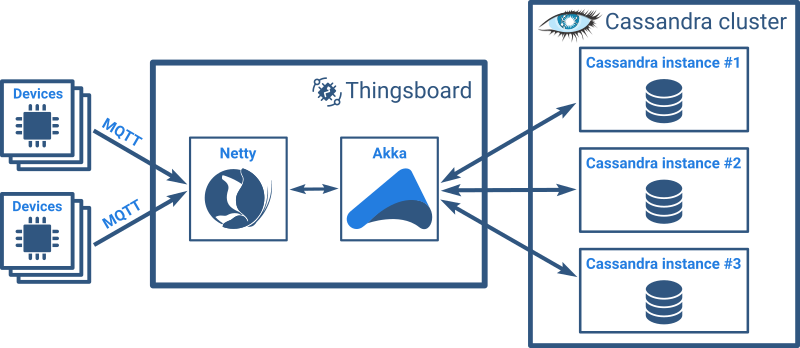
Thingsboard performance leverages three main projects:
|
||
|
||
1. [Netty](http://netty.io/) for high-performance MQTT servers/brokers for IoT devices.
|
||
2. [Akka](http://akka.io/) for high-performance actor systems to coordinate messages between millions of devices.
|
||
3. [Cassandra](http://cassandra.apache.org/) for scalable high-performance NoSQL DBs to store time series data from devices.
|
||
|
||
We also use [Zookeeper](https://zookeeper.apache.org/) for coordination and [gRPC](http://www.grpc.io/) in cluster mode.
|
||
|
||
## Data Flow and Test Tools
|
||
|
||
IoT devices connect to the Thingsboard server via MQTT and issue “publish” commands with the JSON payload. The size of a single published message is approximately 100 bytes. [MQTT](http://mqtt.org/) is a lightweight publish/subscribe messaging protocol that offers a number of advantages over the HTTP request/response protocol.
|
||
|
||
|
||
|
||
|
||
The Thingsboard server processes MQTT publish messages and stores them to Cassandra asynchronously. The server may also push data to WebSocket subscriptions from Web UI dashboards (if present). We try to avoid any blocking operations. This is critical for overall system performance. Thingsboard supports MQTT QoS level 1, which means that the client receives a response to the publish message only after the data is stored to Cassandra DB. Data duplicates that are possible with QoS level 1 are overwritten on the corresponding Cassandra row and thus are not present in the persisting data. This functionality provides reliable data delivery and persistence.
|
||
|
||
We have used the [Gatling](http://gatling.io/) load testing framework that is also based on Akka and Netty. Gatling is able to simulate 10K MQTT clients using 5-10% of a 2-core CPU. See our separate [article](https://dzone.com/articles/load-testing-of-mqtt-servers-using-java-maven-and) about how we improved unofficial Gatling MQTT plugin to support our use case.
|
||
|
||
## Performance Improvement Steps
|
||
|
||
Taking the following steps and using tools similar to those that we use will help improve your system's performance.
|
||
|
||
### 1. Asynchronous Cassandra Driver API
|
||
|
||
The results of the first performance tests on the modern 4-core laptop with SSD were quite poor. The platform was able to process only 200 messages per second. The root cause and main performance bottleneck were quite obvious. It appears that processing was not 100% asynchronous, and we were executing the blocking API call of the Cassandra driver inside the actor. A quick refactoring of the plugin implementation resulted in more than 10x performance improvement — we received approximately 2,500 published messages per second from 1000 devices. We recommend [this article](http://www.datastax.com/dev/blog/java-driver-async-queries) to learn more about async queries to Cassandra.
|
||
|
||
### 2. Connection Pooling
|
||
|
||
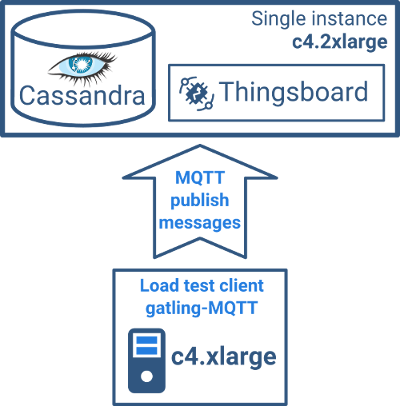
We decided to move to AWS EC2 instances to be able to share both the results and tests that we executed. We started running tests on a [c4.xlarge](http://www.ec2instances.info/?selected=c4.xlarge) instance (4 vCPUs and 7.5 Gb of RAM) with Cassandra and Thingsboard services co-located.
|
||
|
||
|
||
|
||
|
||
Test specifications:
|
||
|
||
- **Number of devices:** 10,000.
|
||
- **Publish frequency per device:** once per second.
|
||
- **Total load:** 1,000 messages per second.
|
||
|
||
The first test results were obviously unacceptable:
|
||
|
||

|
||
|
||
|
||
The huge response time above was caused by the fact that server was simply not able to process 10K messages per second, so they were getting queued.
|
||
|
||
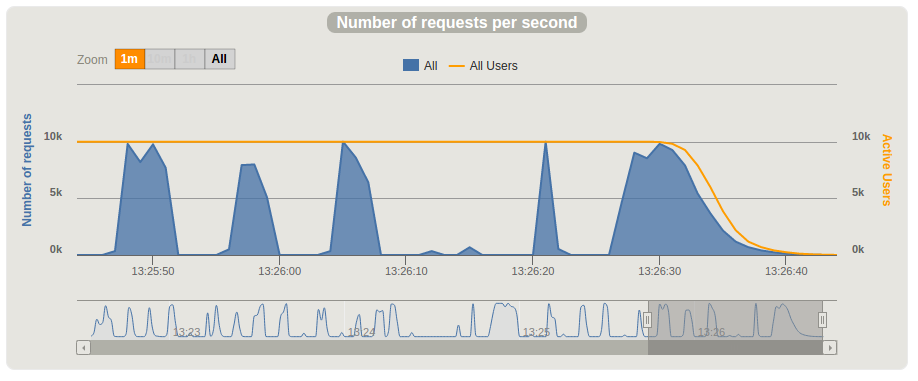
We started our investigation with monitoring memory and CPU load on the testing instance. Initially, we guessed that the reason for the poor performance was the heavy load on CPU or RAM. However, during load testing, we saw that CPU in particular moments was idle for a couple of seconds. This pause was happening every 3-7 seconds. See the chart below.
|
||
|
||
|
||
|
||
|
||
As next the step, we decided to do the thread dump during these pauses. We were expecting to see threads that were blocked, which could give us some clue as to what was happening during the pauses. We opened a separate console to monitor CPU load and another one to execute thread dump while performing stress tests using the following command:
|
||
|
||
`kill -3 THINGSBOARD_PID`
|
||
We identified that during the pause, there was always one thread in the `TIMED_WAITING` state. The root cause was in the `awaitAvailableConnection` method of the Cassandra driver:
|
||
|
||
```
|
||
java.lang.Thread.State: TIMED_WAITING (parking)
|
||
at sun.misc.Unsafe.park(Native Method)
|
||
parking to wait for <0x0000000092d9d390> (a java.util.concurrent.locks.AbstractQueuedSynchronizer$ConditionObject)
|
||
at java.util.concurrent.locks.LockSupport.parkNanos(LockSupport.java:215)
|
||
at java.util.concurrent.locks.AbstractQueuedSynchronizer$ConditionObject.await(AbstractQueuedSynchronizer.java:2163)
|
||
at com.datastax.driver.core.HostConnectionPool.awaitAvailableConnection(HostConnectionPool.java:287)
|
||
at com.datastax.driver.core.HostConnectionPool.waitForConnection(HostConnectionPool.java:328)
|
||
at com.datastax.driver.core.HostConnectionPool.borrowConnection(HostConnectionPool.java:251)
|
||
at com.datastax.driver.core.RequestHandler$SpeculativeExecution.query(RequestHandler.java:301)
|
||
at com.datastax.driver.core.RequestHandler$SpeculativeExecution.sendRequest(RequestHandler.java:281)
|
||
at com.datastax.driver.core.RequestHandler.startNewExecution(RequestHandler.java:115)
|
||
at com.datastax.driver.core.RequestHandler.sendRequest(RequestHandler.java:91)
|
||
at com.datastax.driver.core.SessionManager.executeAsync(SessionManager.java:132)
|
||
at org.thingsboard.server.dao.AbstractDao.executeAsync(AbstractDao.java:91)
|
||
at org.thingsboard.server.dao.AbstractDao.executeAsyncWrite(AbstractDao.java:75)
|
||
at org.thingsboard.server.dao.timeseries.BaseTimeseriesDao.savePartition(BaseTimeseriesDao.java:135)
|
||
```
|
||
As a result, we realized that the default connection pool configuration for tje Cassandra driver caused the poor performance in our use case.
|
||
|
||
The [official configuration](http://docs.datastax.com/en/developer/java-driver/2.1/manual/pooling/) for the connection pool feature contains a special option called "Simultaneous requests per connection" that allows you to tune concurrent requests per single connection. We use Cassandra driver protocol v3, and by default, it uses 1024 for `LOCAL` hosts and 256 for `REMOTE` hosts.
|
||
|
||
Considering the fact that we are actually pulling data from 10,000 devices, default values are definitely not enough. So, we made changes to the code and updated values for `LOCAL` and `REMOTE` hosts and set them to the maximum possible values:
|
||
|
||
```
|
||
poolingOptions
|
||
.setMaxRequestsPerConnection(HostDistance.LOCAL,32768)
|
||
.setMaxRequestsPerConnection(HostDistance.REMOTE,32768);
|
||
```
|
||
Test results after the applied changes are listed below.
|
||
|
||

|
||
|
||
|
||
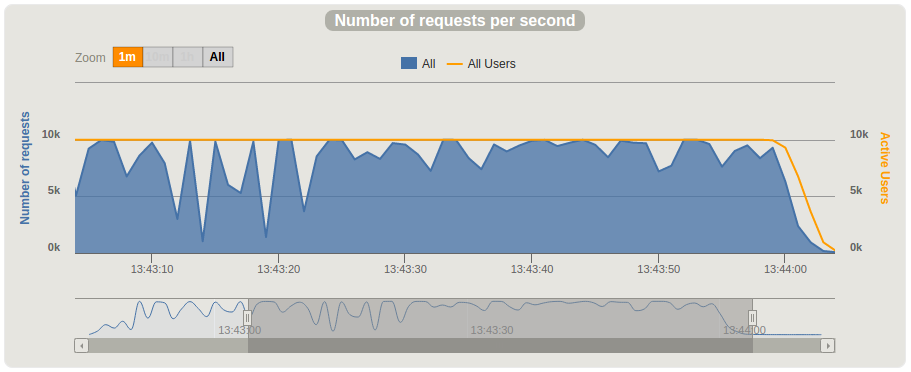 The results were much better, but far from even one million messages per minute. We do not see pauses in CPU load during our tests on c4.xlarge anymore. The CPU load was high (80-95%) during the entire test. We did a couple of thread dumps to verify that the Cassandra driver was not awaiting available connections, and indeed we have not seen this issue anymore.
|
||
|
||
|
||
### 3. Vertical Scaling
|
||
|
||
We decided to run the same tests on a two-times more powerful node, [c4.2xlarge](http://www.ec2instances.info/?selected=c4.2xlarge), with 8 vCPUs and 15GG of RAM. The performance increase was not linear and the CPU was still loaded (80-90%).
|
||
|
||

|
||
|
||
|
||
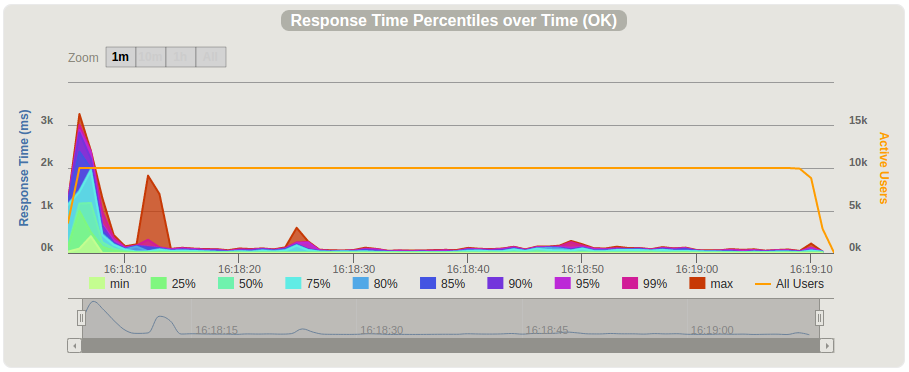
We have noticed a significant improvement in response time. After a significant peak at the start of the test, the maximum response time was within 200ms and the average response time was ~50ms.
|
||
|
||
|
||
|
||
|
||
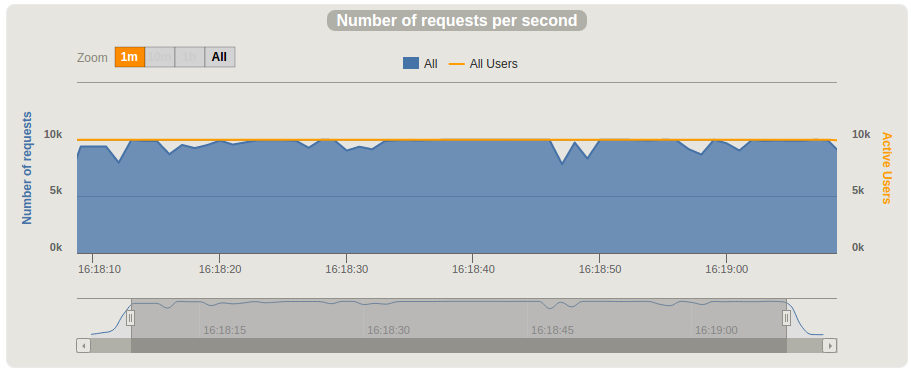
The number of requests per second was around 10K:
|
||
|
||
|
||
|
||
|
||
We also executed a test on [c4.4xlarge](http://www.ec2instances.info/?selected=c4.4xlarge) with 16 vCPUs and 30GB of RAM but did not noticed significant improvements. We decided to separate the Thingsboard server and move Cassandra to the three nodes cluster.
|
||
|
||
### 4. Horizontal Scaling
|
||
|
||
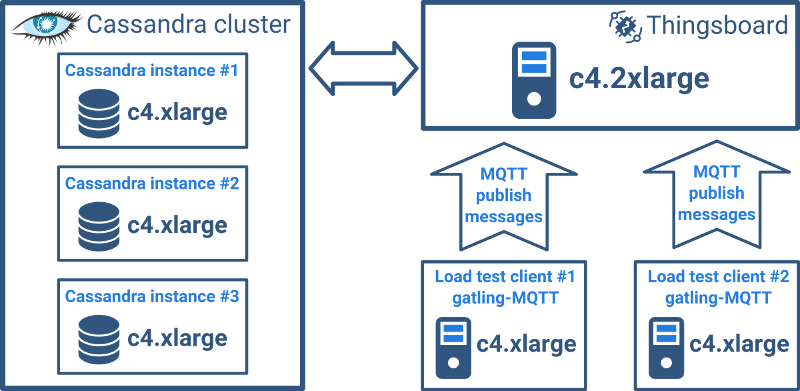
Our main goal was to identify how many MQTT messages we can handle using a single Thingsboard server running on [c4.2xlarge](http://www.ec2instances.info/?selected=c4.2xlarge). (We will cover horizontal scalability of Thingsboard clusters in a separate article.) We decided to move Cassandra to three [c4.xlarge](http://www.ec2instances.info/?selected=c4.xlarge) separate instances with default configuration and launch a Gatling stress test tool from two separate [c4.xlarge](http://www.ec2instances.info/?selected=c4.xlarge) instances simultaneously to minimize the possible effect on latency and throughput by a third party.
|
||
|
||
|
||
|
||
|
||
Test specification:
|
||
|
||
- **Number of devices:** 20,000.
|
||
- **Publish frequency per device:** twice per second.
|
||
- **Total load:** 40,000 messages per second.
|
||
|
||
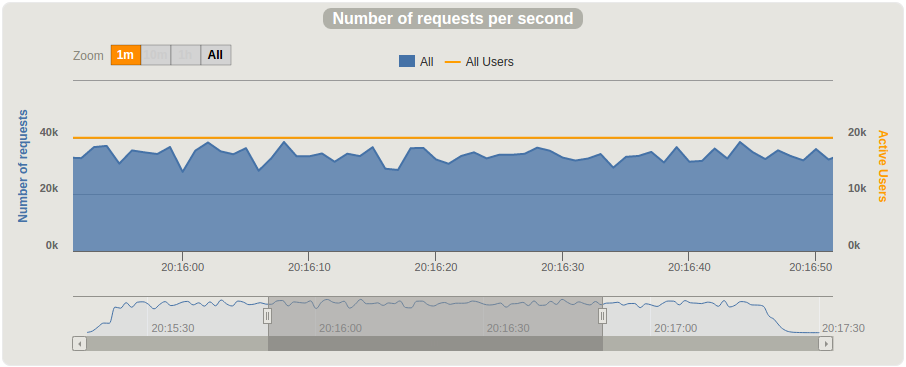
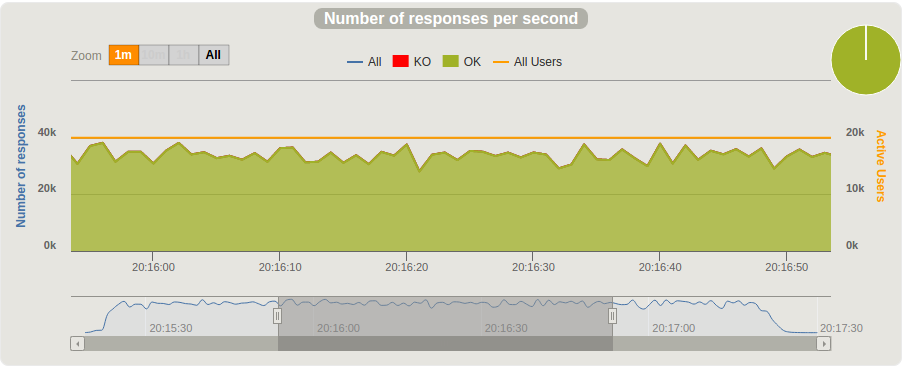
The statistics of two simultaneous test runs launched on different client machines is below:
|
||
|
||

|
||
|
||
|
||
|
||
|
||
|
||
|
||
|
||
|
||
Based on the data from two simultaneous test runs, we have reached 30,000 published messages per second, which is equal to 1.8 million per minute.
|
||
|
||
### How to Repeat the Tests
|
||
|
||
We have prepared several AWS AMIs for anyone who is interested in replication of these tests. See the separate [documentation page](https://thingsboard.io/docs/reference/performance-tests/) with detailed instructions.
|
||
|
||
## Conclusion
|
||
|
||
This performance test demonstrates how small Thingsboard clusters are. They cost approximately $1 per hour and can easily receive, store, and visualize more than 100 million messages from your devices. We will continue our work on performance improvements and will publish the performance results for clusters of Thingsboard servers in our next article.
|
||
|
||
We hope this article will be useful for people who are evaluating the platform and want to execute performance tests on their own. We also hope that the performance improvement steps will be useful for any engineers who use similar technologies.
|
||
|
||
Please let us know your feedback and follow our project on [GitHub](https://github.com/thingsboard/thingsboard) or [Twitter](https://twitter.com/thingsboard).
|
||
|
||
Testing
|
||
|
||
|
||
Opinions expressed by DZone contributors are their own.
|
||
|
||
Comments
|