
150 lines
9.2 KiB
Markdown
150 lines
9.2 KiB
Markdown
# How we improved on-call life by reducing pager noise
|
||
|
||
- **期号**: SRE Weekly Issue #332(2022-07-31)
|
||
- **作者**: steveazz — GitLab
|
||
- **链接**: https://about.gitlab.com/blog/2022/07/19/reducing-pager-fatigue-and-improving-on-call-life/
|
||
|
||
## 简介
|
||
|
||
Coalescing alerts and adding dependencies in AlertManager were the key to reducing this team’s excessive pager load.
|
||
|
||
## 正文
|
||
|
||
To search repositories and projects, login to [gitlab.com](https://gitlab.com/users/sign_in/).
|
||
|
||
Ship at agent speed. Prove every step. Transcend returns on October 6.Register now
|
||
|
||
Published on: July 19, 2022
|
||
|
||
5 min read
|
||
|
||
Too many pages? Here's how we tackled on-call SRE quality of life by grouping alerts by service and only paging on downstream services.
|
||
|
||
To monitor the health of GitLab.com we use multiple
|
||
[SLIs](https://sre.google/workbook/implementing-slos/#what-to-measure-using-slis)
|
||
for each service. We then page the on-call when one of these SLIs is not
|
||
meeting our internal [SLOs and burning through the error
|
||
budget](https://sre.google/workbook/implementing-slos/#decision-making-using-slos-and-error-budgets)
|
||
with the hopes of fixing the problem before too many of our users even notice.
|
||
|
||
All of our services SLIs and SLOs are defined using [jsonnet](https://jsonnet.org/) in
|
||
what we call the [metrics-catalog](https://gitlab.com/gitlab-com/runbooks/-/tree/168397dee0ad955bfb473fd0ddb9146667eeaa13/metrics-catalog)
|
||
where we specify a service and its SLIs/SLOs. For example, the [`web-pages`](https://gitlab.com/gitlab-com/runbooks/-/blob/168397dee0ad955bfb473fd0ddb9146667eeaa13/metrics-catalog/services/web-pages.jsonnet)
|
||
service has [an apdex SLO of 99.5%](https://gitlab.com/gitlab-com/runbooks/-/blob/168397dee0ad955bfb473fd0ddb9146667eeaa13/metrics-catalog/services/web-pages.jsonnet#L22)
|
||
and multiple SLIs such as [loadbalancer](https://gitlab.com/gitlab-com/runbooks/-/blob/168397dee0ad955bfb473fd0ddb9146667eeaa13/metrics-catalog/services/web-pages.jsonnet#L60),
|
||
[go server](https://gitlab.com/gitlab-com/runbooks/-/blob/168397dee0ad955bfb473fd0ddb9146667eeaa13/metrics-catalog/services/web-pages.jsonnet#L80),
|
||
and [time to write HTTP headers](https://gitlab.com/gitlab-com/runbooks/-/blob/168397dee0ad955bfb473fd0ddb9146667eeaa13/metrics-catalog/services/web-pages.jsonnet#L113).
|
||
Having these in code we can automatically generate Prometheus [recording rules](https://prometheus.io/docs/prometheus/latest/configuration/recording_rules/)
|
||
and [alerting rules](https://prometheus.io/docs/prometheus/latest/configuration/alerting_rules/)
|
||
following [multiple burn rate alerts](https://sre.google/workbook/alerting-on-slos/#5-multiple-burn-rate-alerts).
|
||
Every time we start burning through our 30-day error budget for an SLI too fast
|
||
we page the SRE on-call to investigate and solve the problem.
|
||
|
||
This setup has been working well for us for over two years now, but one big
|
||
pain point remained when there was a service-wide degradation. The SRE on-call
|
||
was getting paged **for every SLI** associated with a service or its
|
||
downstream dependencies, meaning they can get up to 10 pages per service since
|
||
the service has 3-5 SLIs on average and we also have regional and canary SLIs.
|
||
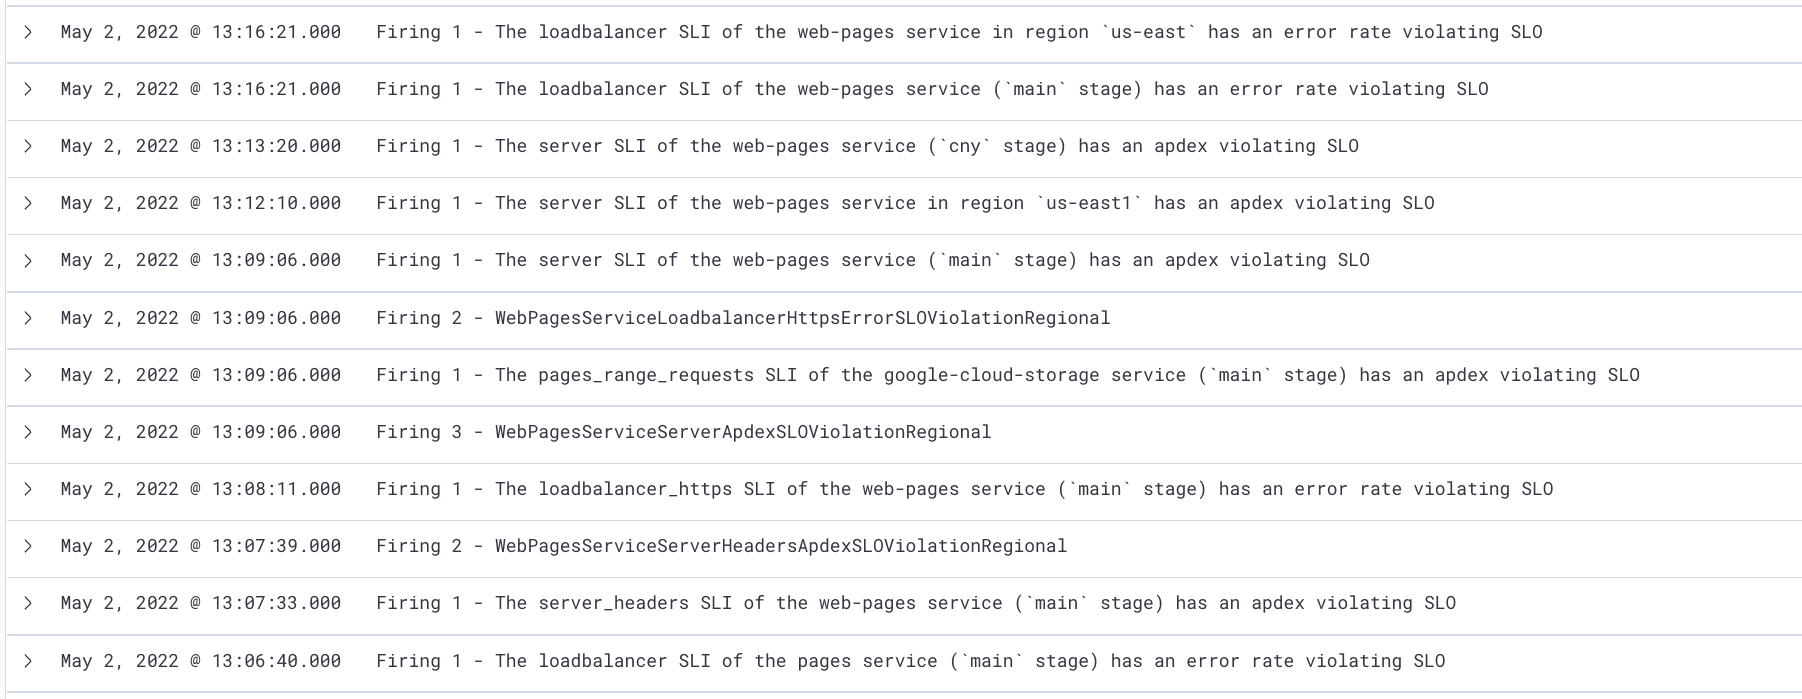
This gets very distracting, it's stress-inducing, and it also doesn't let the
|
||
on-call focus on solving the problem but just acknowledges pages. For example
|
||
below we can see the on-call getting paged 11 times in 5 minutes for the same
|
||
service.
|
||
|
||
|
||
|
||
|
||
What is even worse is when we have a site-wide outage, where the on-call can end up getting 50+ pages because all services are in a degraded state.
|
||
|
||

|
||
|
||
|
||
It was a big problem for the quality of life for the on-call and we needed to
|
||
fix this. We started doing some research on how to best solve this problem and
|
||
opened an issue to [document all possible
|
||
solutions](https://gitlab.com/gitlab-com/gl-infra/reliability/-/issues/15721).
|
||
After some time we decided to go with grouping alerts by service and
|
||
introducing service dependencies for alerting/paging.
|
||
|
||
The smallest and most effective iteration was to group the alerts by the
|
||
service. Taking the previous example where the `web-pages` service paged the
|
||
on-call 11 times, it should have only paged the on-call once, and shown
|
||
which SLIs were affected. We use [Alertmanager](https://prometheus.io/docs/alerting/latest/alertmanager/) for
|
||
all our alerting logic, and this already had a feature called
|
||
[grouping](https://prometheus.io/docs/alerting/latest/alertmanager/#grouping)
|
||
so we could group alerts by labels.
|
||
|
||
This is what an alert looks like in our Prometheus setup:
|
||
|
||
```
|
||
ALERTS{aggregation="regional_component", alert_class="slo_violation", alert_type="symptom", alertname="WebPagesServiceServerApdexSLOViolationRegional", alertstate="firing", component="server", env="gprd", environment="gprd", feature_category="pages", monitor="global", pager="pagerduty", region="us-east1-d", rules_domain="general", severity="s2", sli_type="apdex", slo_alert="yes", stage="main", tier="sv", type="web-pages", user_impacting="yes", window="1h"}
|
||
```
|
||
All alerts have the `type` label attached to them to specify which service they
|
||
belong to. We can use this label and the `env` label to group all the
|
||
production alerts that are firing for the `web-pages` service.
|
||
|
||

|
||
|
||
|
||
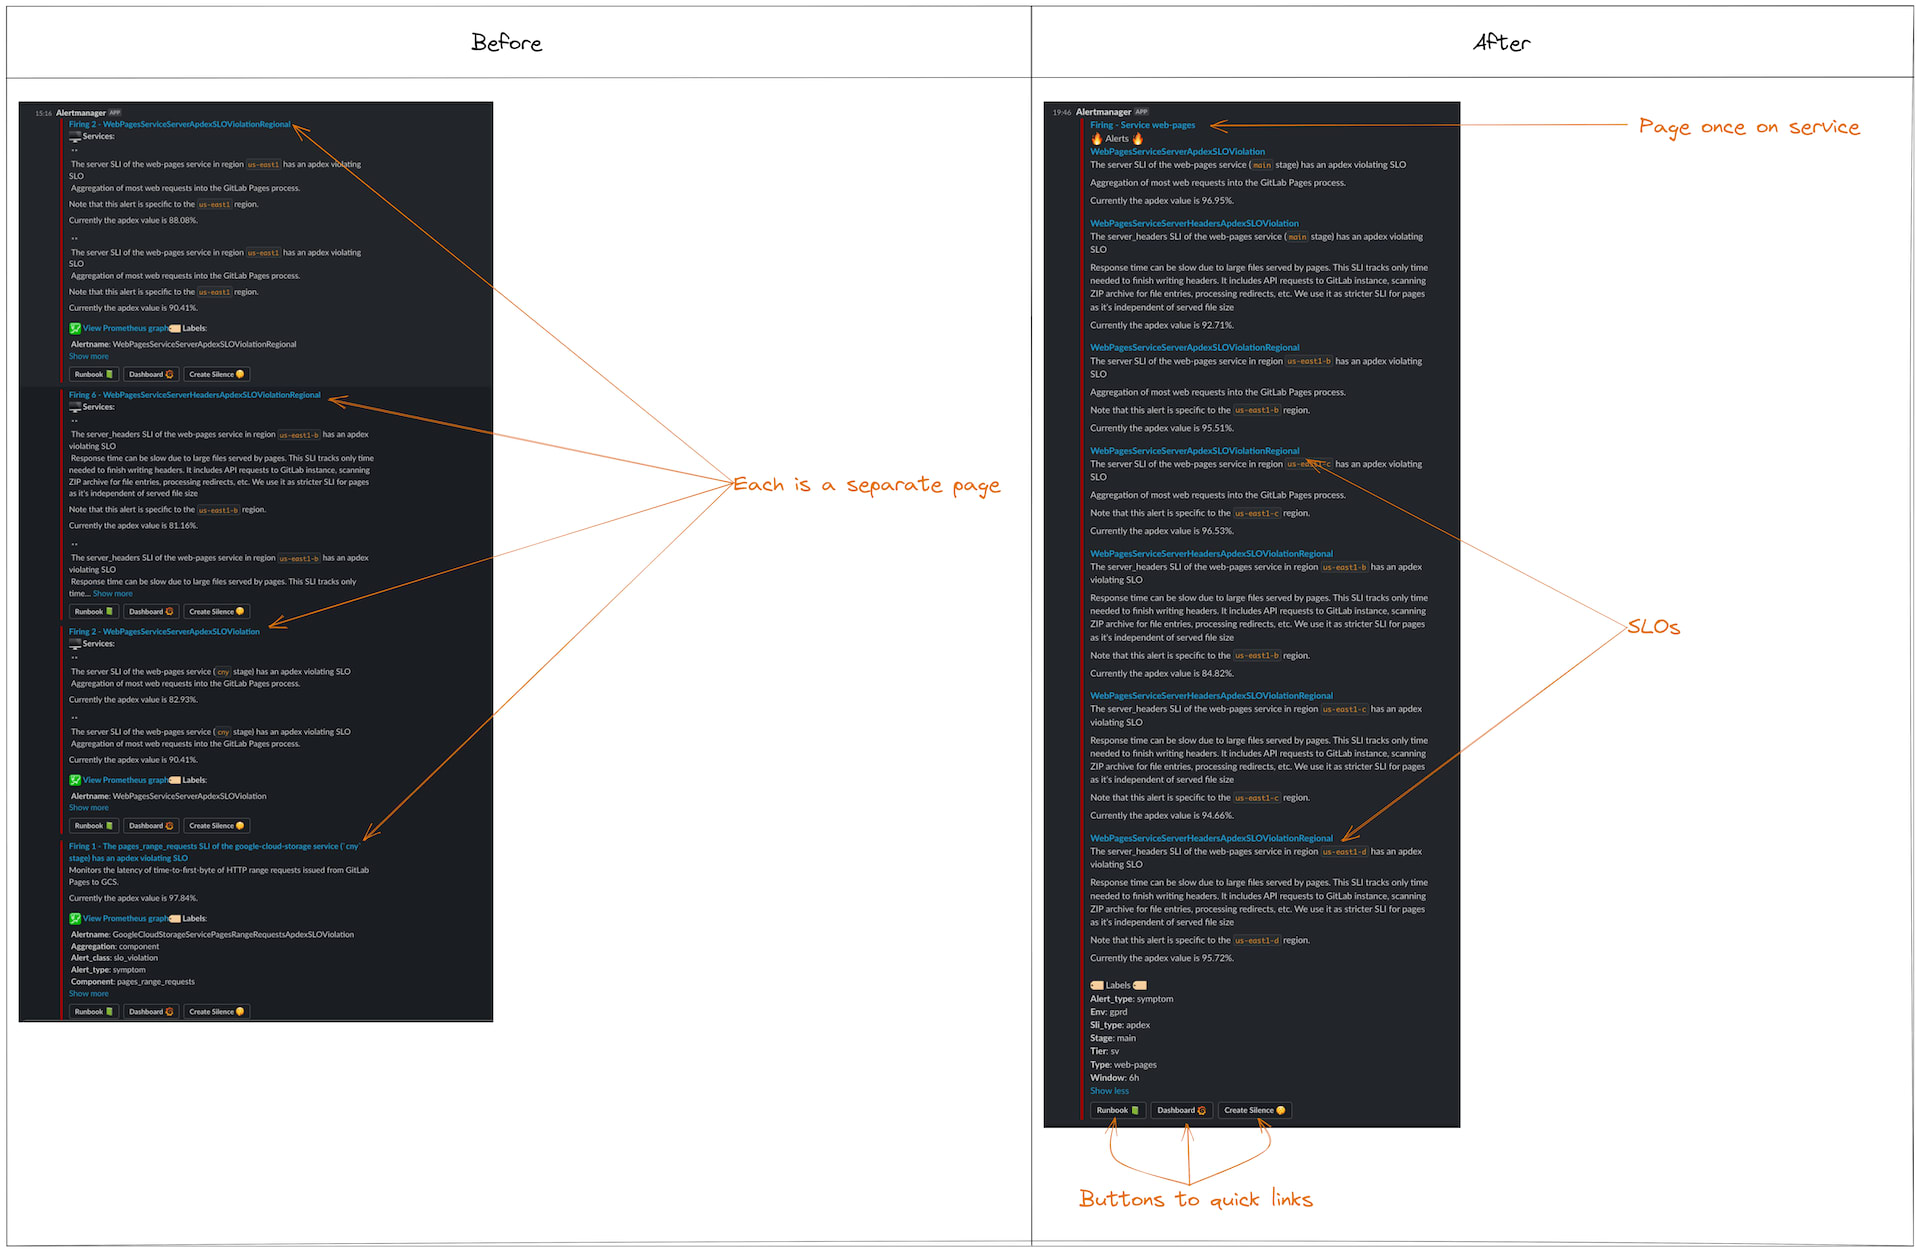
We also had to update our Pagerduty and Slack templates to show the right
|
||
information. Before we only showed the alert title and description but this had
|
||
to change since we are now alerting by service rather than by 1 specific SLO.
|
||
You can see the changes at [runbooks!4684](https://gitlab.com/gitlab-com/runbooks/-/merge_requests/4684).
|
||
|
||
|
||
|
||
|
||
This was already a big win! The on-call now gets a page saying "service web-pages" and then the list of SLIs that are burning through the error budget - we went from 11 pages to 1 page!
|
||
|
||
However we still had the problem that when a downstream service (such as the database)
|
||
starts burning through the error budget, it has a cascading effect where `web`,
|
||
`git`, and `api` will also start burning through the error budget and page the
|
||
on-call for each service. That was the next thing that we had to solve.
|
||
|
||
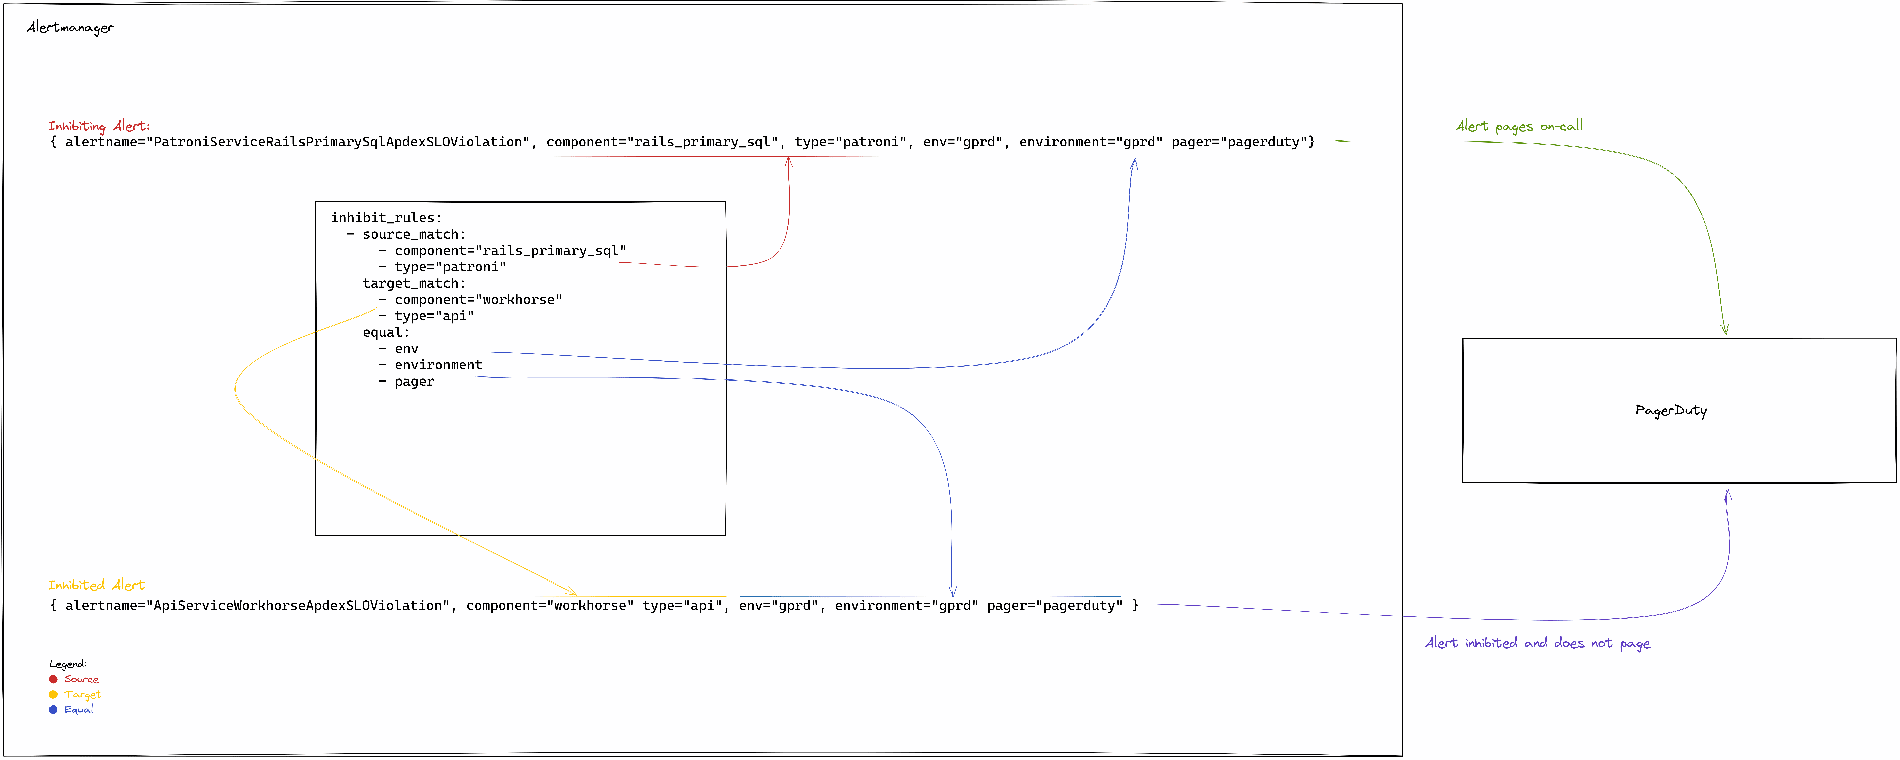
We needed some way to not alert on the `api` service if the `patroni`
|
||
(database) service was burning through the error budget because it's clear if the
|
||
database is degraded the `api` service will end up degraded as well. We used
|
||
another feature of Alertmanager called
|
||
[inhibition](https://prometheus.io/docs/alerting/latest/alertmanager/#inhibition)
|
||
where we can tell Alertmanager to not alert on `api` if some alerts on `patroni`
|
||
are already firing.
|
||
|
||
|
||
|
||
|
||
I've mentioned that all of our SLIs/SLOs are inside of the
|
||
[metrics-catalog](https://gitlab.com/gitlab-com/runbooks/-/tree/168397dee0ad955bfb473fd0ddb9146667eeaa13/metrics-catalog)
|
||
so it was a natural fit to add dependencies there, and this is exactly what
|
||
we did in [runbooks!4710](https://gitlab.com/gitlab-com/runbooks/-/merge_requests/4710). With this
|
||
we can specify that an SLI depends on another SLI of a different service which
|
||
will automatically create
|
||
[`inhibit_rules`](https://prometheus.io/docs/alerting/latest/configuration/#inhibit_rule)
|
||
for Alertmanager.
|
||
|
||
Since inhibit rules could potentially prevent alerting someone, we've used these sparingly. To avoid creating inhibit rules too broadly, we've implemented the following restrictions:
|
||
|
||
1. An SLI can't depend on an SLI of the same service.
|
||
2. The SLI has to exist for that service.
|
||
3. We only allow equal operations, no regex on SLIs.
|
||
|
||
After that it was only a matter of adding the `dependsOn` on each service for example:
|
||
|
||
The `web-pages` inhibit rule shows a chain of dependencies from `web-pages -> api -> patroni`, so if `patroni` is burning through the error budget it will
|
||
not page for `api` and `web-pages` services anymore!
|
||
|
||
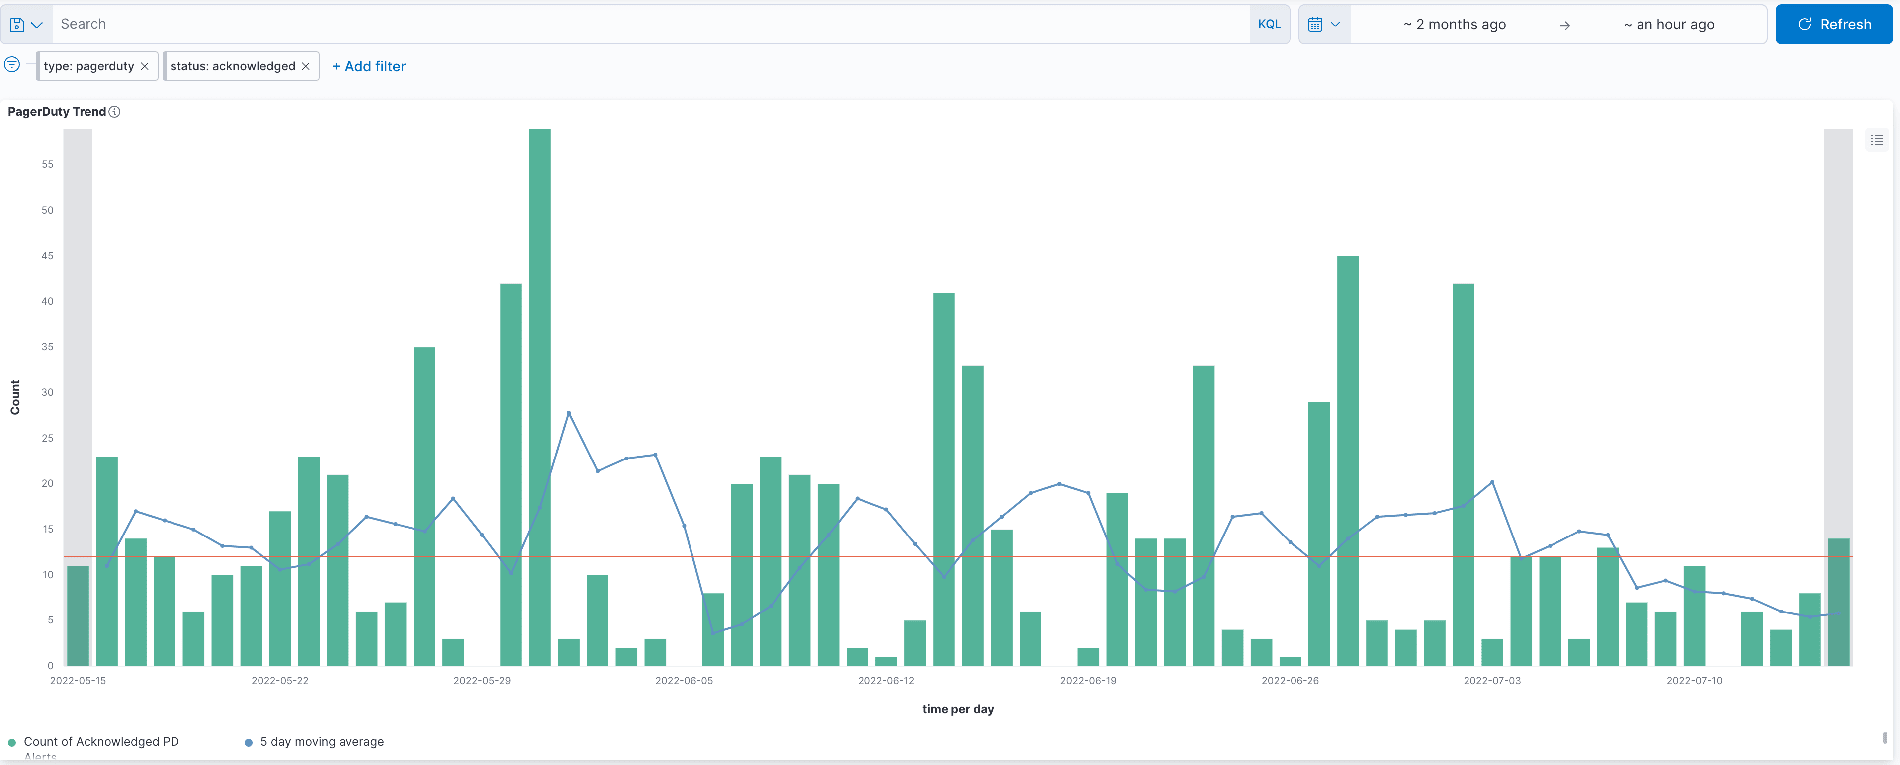
We have been using alert grouping and service dependencies for over a month now, and we have already seen some improvements:
|
||
|
||
1. The on-call only gets paged once per service.
|
||
2. When there is a large site-wide outage they only get paged 5-10 times since we have external probes that also alert us.
|
||
3. There is an overall downward trend on pages for the on-call as seen below.
|
||
|
||
|
||
|
||
|
||
Engineering
|
||
|
||
Enjoyed reading this blog post or have questions or feedback? Share your thoughts by creating a new topic in the GitLab community forum.
|
||
|
||
Start building faster today
|
||
|
||
See what your team can do with the intelligent orchestration platform for DevSecOps.
|