
97 lines
5.6 KiB
Markdown
97 lines
5.6 KiB
Markdown
# Documenting your architecture: Wireshark, PlantUML and a REPL to glue them all.
|
||
|
||
- **期号**: SRE Weekly Issue #90(2017-09-24)
|
||
- **作者**: Thanks to Devops Weekly for this one.
|
||
- **链接**: http://danlebrero.com/2017/04/06/documenting-your-architecture-wireshark-plantuml-and-a-repl/
|
||
|
||
## 简介
|
||
|
||
This is a really neat idea: generate an interaction diagram automatically using a packet capture and a UML tool.
|
||
|
||
## 正文
|
||
|
||
# Documenting your architecture: Wireshark, PlantUML and a REPL to glue them all.
|
||
|
||
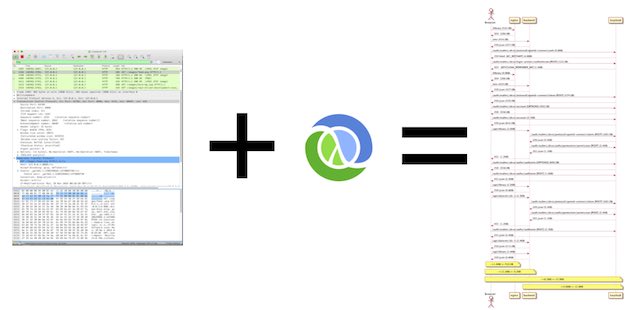
Instead of drawing UML diagrams, why not generate them from a network traffic capture of the running system?
|
||
|
||
|
||
|
||
I recently had to document the results of the evaluation of a new system.
|
||
|
||
The proof of concept for the system included six possible configurations, each option having a significant architectural impact on the system.
|
||
|
||
To understand all six, I have been squinting at the logs from the servers plus the Chrome DevTools network panel, trying to correlate the requests with the responses and the traffic between the servers.
|
||
|
||
As part of the documentation I thought it would be important to have some sequence diagrams to explain the protocol between the different parts of the system.
|
||
|
||
But when trying to draw the sequence diagrams, I realized that all that squinting had just allowed me to grasp the general feeling of the difference between the options, but not enough to write down a proper and accurate description of each one.
|
||
|
||
Also, the prospective boredom of opening my least hated UML tool and spending some hours dragging and dropping boxes and fiddling around with lines, didn’t fill me with joy.
|
||
|
||
Given that I already had the six combinations running for the proof of concept, couldn’t I leverage on that?
|
||
|
||
## The tools
|
||
|
||
First, we need to find out all the traffic between the components of the system. For this we will use the venerable [Wireshark](https://www.wireshark.org/).
|
||
|
||
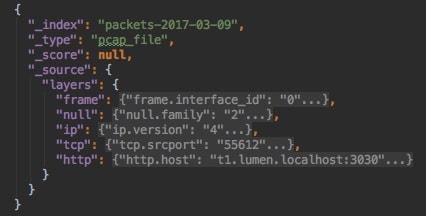
Wireshark will allow us to capture any network traffic, filtering out anything unnecessary, plus it comes with a handy [export to json](http://stackoverflow.com/a/40540149) feature to simplify the parsing of the output.
|
||
|
||
A snippet of what a HTTP request looks like:
|
||
|
||
|
||
|
||
|
||
Second, we will need to generate the UML diagrams. For this we will use [PlantUML](http://plantuml.com), which is a text based UML DSL with the accompanying libraries to generate images. Being text based, our problem of generating UML diagrams becomes one of string concatenation.
|
||
|
||
Lastly, we need some glue to transform the Wireshark json files to PlantUML text files. We will use Clojure but any turing complete language would do. Of course, a [Clojure REPL](http://danlebrero.com/2018/11/26/repl-driven-development-immediate-feedback-for-you-backend/#content) makes the task more pleasant.
|
||
|
||
## The result
|
||
|
||
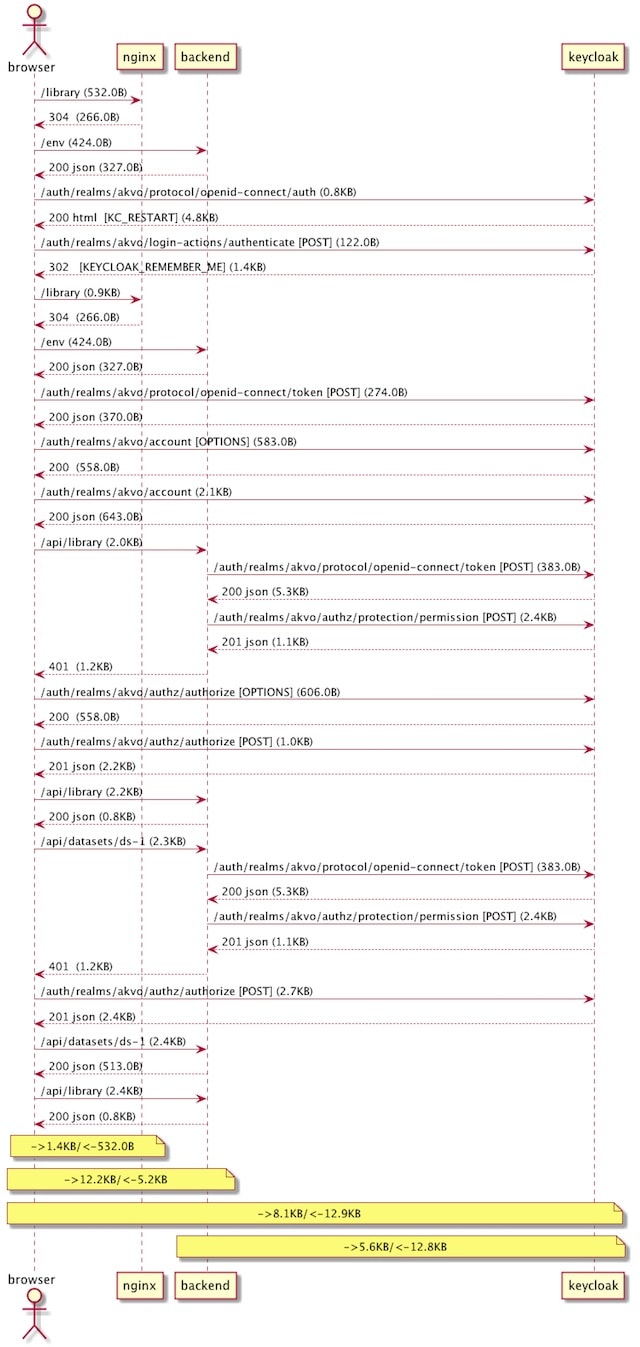
First, to show off, lets look at how one of the diagrams looks like:
|
||
|
||
|
||
|
||
|
||
This diagram requires 40 lines of PlantUML that look like:
|
||
|
||
```
|
||
browser -> backend: /api/datasets/ds-1 (536.0B)
|
||
browser <-- backend: 200 json (0.7KB)
|
||
browser -> backend: /api/library (525.0B)
|
||
browser <-- backend: 200 json (1.0KB)
|
||
note over browser, nginx: ->1.2KB/<-532.0B
|
||
note over browser, backend: ->4.4KB/<-5.3KB
|
||
```
|
||
The whole PlantUML code is [here](https://gist.githubusercontent.com/dlebrero/acf5d1ba5156bc10048d006d6f18705c/raw/fb432f56cb7ec043f027d6d3d3373f5b69283987/plantuml.puml) and the code can be found [here](https://github.com/dlebrero/wireshark-plantuml).
|
||
|
||
If you are curious, the diagram corresponds to loading a [Single-page application](https://en.wikipedia.org/wiki/Single-page_application), doing authentication with [OpenID Connect](https://en.wikipedia.org/wiki/OpenID_Connect) and authorizing an API endpoint with [User-Managed Access](https://en.wikipedia.org/wiki/User-Managed_Access).
|
||
|
||
## Benefits
|
||
|
||
The benefits of using these three tools are:
|
||
|
||
1. We are able to generate a set of diagrams that are accurate, giving you the confidence that you are not missing anything. Assuming no bugs in the parsing code .
|
||
2. As the set of diagrams are generated using the same code, they all look consistent, both in the data that they contain and in their look and feel.
|
||
3. The data, the diagrams and the code to generate them are all text, which means that can be version control and manually inspected or tweaked if required.
|
||
4. If we decide to change any details about the diagrams, it will take no time to update all diagrams.
|
||
5. Maybe the code to generate the diagrams can be used in other projects.
|
||
6. The diagrams have the desired level of detail. For example, in the diagrams we have removed the loading of images, css and javascript files.
|
||
7. You can add a great deal of detail to the diagrams, as the data capture has even the request/response, so you could parse them and extract the information that was relevant to your system.
|
||
8. You can do all from your favourite IDE in an interactive fashion:
|
||
|
||
## Drawbacks
|
||
|
||
Of course there are some drawbacks:
|
||
|
||
1. We have to have the system working and we have to be able to sniff the traffic.
|
||
2. The data capture can be huge, so some pre-filtering during the capture phase maybe necessary.
|
||
3. There can be sensitive data in the capture. Be careful with the security!
|
||
|
||
## More benefits!
|
||
|
||
Last, but probably the most important benefit, is that we have converted a tedious task into an enjoyable one.
|
||
|
||
I never thought I would say this but … Happy documenting!
|
||
|
||
[Follow @DanLebrero](https://twitter.com/DanLebrero)or share!
|