
43 lines
3.1 KiB
Markdown
43 lines
3.1 KiB
Markdown
# The Tail at Scale Approximation
|
||
|
||
- **期号**: SRE Weekly Issue #228(2020-07-19)
|
||
- **作者**: Bill Duncan
|
||
- **链接**: https://billduncan.org/the-tail-at-scale-approximation/
|
||
|
||
## 简介
|
||
|
||
Bill Duncan’s back with an easy and very close approximation for the “Tail at Scale” formula. The question it answers is: how many nines do you need on all of your backend microservices for X nines on the frontend?
|
||
|
||
## 正文
|
||
|
||
This article demonstrates a quick and easy approximation for the probability formulae which I described in two previous articles.
|
||
|
||
For background, see these two articles:
|
||
|
||
## TL;DR
|
||
|
||
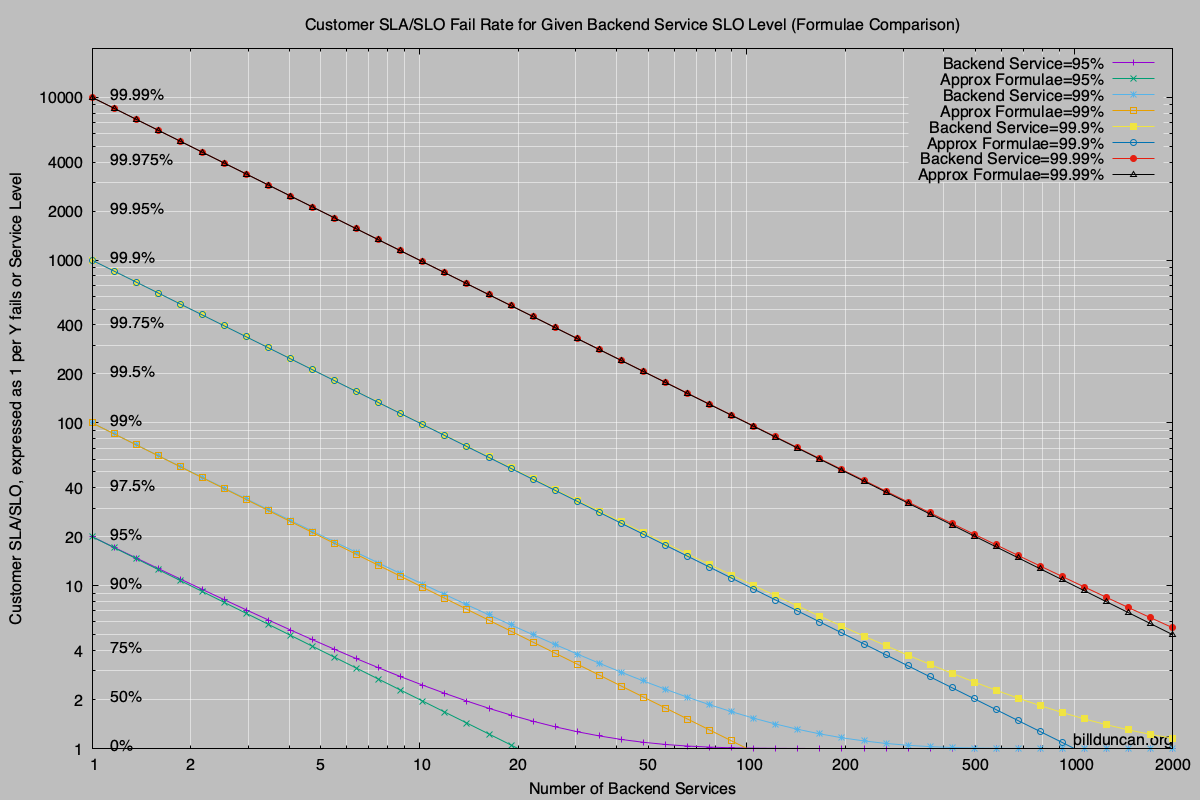
Given a desired customer facing SLO/SLA, divide the corresponding failure rate by the number of backend services which will give you a very close approximation of the failure rate that you’ll need to achieve or do better than in the backend.
|
||
|
||
|
||
The approximation is very close up to the point where the customer experience becomes so bad that they won’t notice the difference. (*There likely won’t be many customers left.*) Anything worse than a service level of about 90% (1 failure in 10) for the customer and the approximation starts diverging from the real formulae and becomes less useful.
|
||
|
||
|
||
|
||
## Details and Examples
|
||
|
||
For example, take the two lines that represent 99% service level (1 failure in 100) in the backend. At 10 backend services both formulae suggest that the customer experiences 90% service level (1 failure in 10). At 100 backend services the approximation suggests that the customer experiences failures 100% of the time where in reality there is a 37% chance of success. (This is mathematically intuitive, as in reality the probable overall failure rate approaches but never quite reaches 100%.)
|
||
|
||
However, for all practical purposes where the customer experiences better than a 90% service level, the simple approximation is *close enough* as you can see in the graph.
|
||
|
||
Using a reasonable example, let’s say we assume customers can tolerate a success rate of 95% (1 fail in 20) and we have up to 50 services in the backend. The real probability formulae says you need better than a service level of 99.8975% (1 fail in 975.3) in the backend. The approximation gives us 1/(20*50) or 1 fail in 1000, 99.9% service level, or close enough to the actual formulae to be useful.
|
||
|
||
Probabilities will rarely ever match reality anyway, as there are so many variables that can’t be controlled. (Do all your backend services have *exactly* the same failure rates? *No*.) Nevertheless, a useful approximation to get you in the neighbourhood.
|
||
|
||
Keep in mind that the number you arrive at with either formulae specifies what you’ll need to achieve with the *worst* performing backend service. As an exaggerated example, say two services are required; one has a success rate of 50% and the other 90%. *The overall success rate will always be worse than the worst service;* in this case a success rate of 45%, or 100*0.5*0.9.
|
||
|
||
*Probably..*
|
||
|
||
## One thought on “The Tail at Scale Approximation”
|
||
|
||
Comments are closed.
|