
123 lines
7.2 KiB
Markdown
123 lines
7.2 KiB
Markdown
# Heterogeneous SLI vs Homogeneous SLI
|
||
|
||
- **期号**: SRE Weekly Issue #443(2024-09-22)
|
||
- **作者**: Alex Ewerlöf
|
||
- **链接**: https://blog.alexewerlof.com/p/sli-heterogeneous-vs-homogeneous
|
||
|
||
## 简介
|
||
|
||
There’s a subtle distinction between heterogeneous and homogeneous SLIs, but it’s important to understand which kind you’re working with and the pros and cons of each.
|
||
|
||
## 正文
|
||
|
||
At the heart of the [Service Levels](https://blog.alexewerlof.com/p/sli) is the ratio between [good](https://blog.alexewerlof.com/p/sli-good) and [valid](https://blog.alexewerlof.com/p/valid-vs-total):
|
||
|
||
- Percentage of `requests` where`response.latency < 300ms`
|
||
- Percentage of `uptime probes` where`response.code == 200`
|
||
- Percentage of `database records` where`fields.*.age < 365 days`
|
||
- Percentage of `authenticated API requests` where`http_response.code < 500`
|
||
|
||
When it comes to implement and calculate those percentages, there are two approaches:
|
||
|
||
- **Heterogeneous:** good and valid are two different metrics with an assumed correlation.
|
||
- **Homogeneous:** good and valid come from processing the same metric where good and valid are tightly coupled
|
||
|
||
This article introduces both types with examples and illustrations ending with a recommendation.
|
||
|
||
## Heterogeneous
|
||
|
||
This type of SLI queries two different metrics to count the number of:
|
||
|
||
Good and valid:
|
||
|
||
or good and bad:
|
||
|
||
or bad and valid:
|
||
|
||
Regardless of the approach, it ends up querying two metrics.
|
||
|
||
Example: Availability of online purchase flow:
|
||
|
||
- Valid: number of unique sessions where the user clicked on the “Pay” button on the check out page
|
||
- Bad: number of payments failing due to payment gateway issues
|
||
- Good = Valid - Bad
|
||
|
||
*Note: we deliberately filter out other failures like: when the user doesn’t have enough money, or entered the wrong payment information because [you should never be responsible for what you don't control](https://blog.alexewerlof.com/p/responsible-for-control).*
|
||
|
||
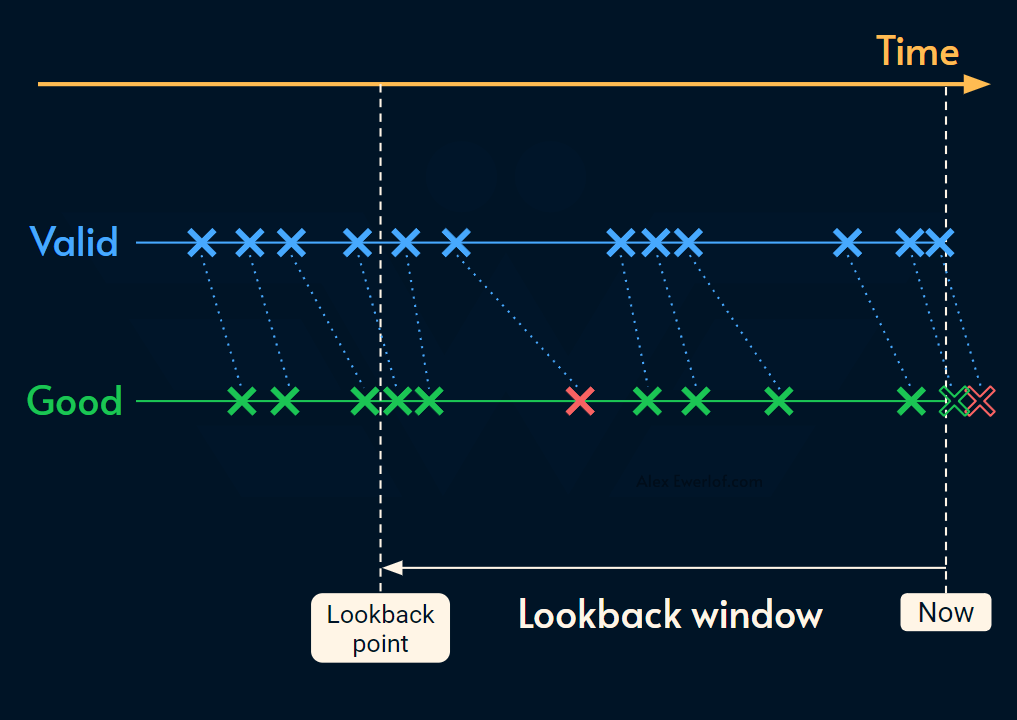
On the surface, it looks reasonable, but in practice there are multiple nuances. The biggest issue is the assumed correlation between the datapoints of two different metrics over time:
|
||
|
||
|
||
|
||
This is because the data points of two separate metrics don’t exactly match. As a result, for any type of lookback window (e.g. SLS or Alerting), we may end up with an inaccurate measurement.
|
||
|
||
The problem doesn’t stop at the timestamp level. It is practically impossible to guarantee a 1-1 mapping between valid events and good events when they’re measuring different things, at different locations, and different times.
|
||
|
||
Another obvious issue is the fact that we need to measure, store, and query two separate metrics (`valid` and either `good` or `bad`).
|
||
|
||
### Pros
|
||
|
||
- Can correlate events across different systems which may map better to how the consumers perceives reliability of the service
|
||
- Easier to reason about for beginners
|
||
- Easier to implement by conventional Observability providers (in the next articles we’ll review how Elastic, Datadog, and Grafana implement service levels)
|
||
|
||
### Cons
|
||
|
||
- It might be harder to work with two datasets due to broken correlation between datapoints.
|
||
- Less efficient due to requiring 2 metrics
|
||
|
||
## Homogeneous
|
||
|
||
Homogeneous SLIs come directly from the fact that the SLI formula is a percentage:
|
||
|
||
All you have to do is to:
|
||
|
||
1. Filter the metric to only contain valid data points
|
||
2. Go through the data points and count the number of good (or bad) events
|
||
3. Divide it by the total number of data points
|
||
|
||
It’s easier to show it with a diagram:
|
||
|
||

|
||
|
||
The biggest advantage of this method is the reliable correlation between good, bad and valid.
|
||
|
||
*Note: an upcoming feature of [SLC](https://slc.alexewerlof.com/), introduces a simulator. It uses an O(1) algorithm to process the metric data in one pass. I’ll write more about that technique once the feature is out.*
|
||
|
||
An obvious advantage of a homogeneous SLI is that it only needs to measure, store, and query one metric.
|
||
|
||
The downside is that your SLI may not readily be one metric. You may need to use a data processing pipeline that takes in 2 metrics in and spits out a clean homogeneous SLI. This can introduce a delay and cost to your setup.
|
||
|
||

|
||
|
||
The good news is that most metrics don’t need this type of processing. For example:
|
||
|
||
- `Uptime calculation:` divide the percentage of successful probes during the window, multiply by 100
|
||
- `Percentage of authenticated requests where latency < 200ms` : find all the authenticated requests in the window, filter out any events where latency ≥ 200 and divide this count to the total number of requests x 100
|
||
|
||
### Pros
|
||
|
||
- It is more intuitive because it’s closer to how normalized SLI is literally defined
|
||
- It requires half as many metrics (only `valid` )
|
||
- The SLS calculations essentially turns into a percentile calculation so it is easier to reason about the dataset
|
||
|
||
### Cons
|
||
|
||
- When the good and valid come from different systems, it requires extra processing to corelate the events which adds to the cost and complexity
|
||
- None of the observability providers that I have investigated (Datadog, Elastic, Grafana) support homogeneous metrics out of the box.
|
||
|
||
# When to use which?
|
||
|
||
Whether you use homogeneous or heterogeneous metrics depends on how the consumers perceive reliability, your tooling, and budget (time, and money).
|
||
|
||
Homogeneous metrics are easier to reason about and often come naturally out of the box.
|
||
|
||
If you can ensure a tight coupling between the two metrics, a heterogenous metric can work too.
|
||
|
||
*These posts take anywhere from a few hours to a few days to ideate, draft, research, illustrate, edit, and publish. I pull these hours from my private time, vacation days and weekends.*
|
||
|
||
*Recently I went down in working hours and salary by 10% to be able to spend more time learning and sharing my experience with the public.*
|
||
|
||
[My monetization strategy](https://blog.alexewerlof.com/p/faq#%C2%A7payment) is to give away most content for free because I believe information should be free and accessible. You can support this cause by sparing a few bucks for a paid subscription. As a token of appreciation, you get access to the Pro-Tips sections (on some articles) as well as my online book [Reliability Engineering Mindset](https://blog.alexewerlof.com/p/rem). Right now, you can get 20% off via [this link](https://blog.alexewerlof.com/protipsdiscount). You can also [invite your friends](https://blog.alexewerlof.com/leaderboard) to gain free access or get a discounted group subscription. There’s also a [referral bonus program to gain free subscriptions](https://blog.alexewerlof.com/leaderboard).
|
||
|
||
*Thanks in advance for helping these words reach further and impact the software engineering community.*
|